Microsoft Fabric Data Warehouse Optimization — Complete 2026 Guide
Storage organization, ingestion patterns, query tuning, V-Order, Direct Lake on SQL, proactive statistics, materialized views, capacity planning, and the June 2026 updates — all verified against official Microsoft documentation.
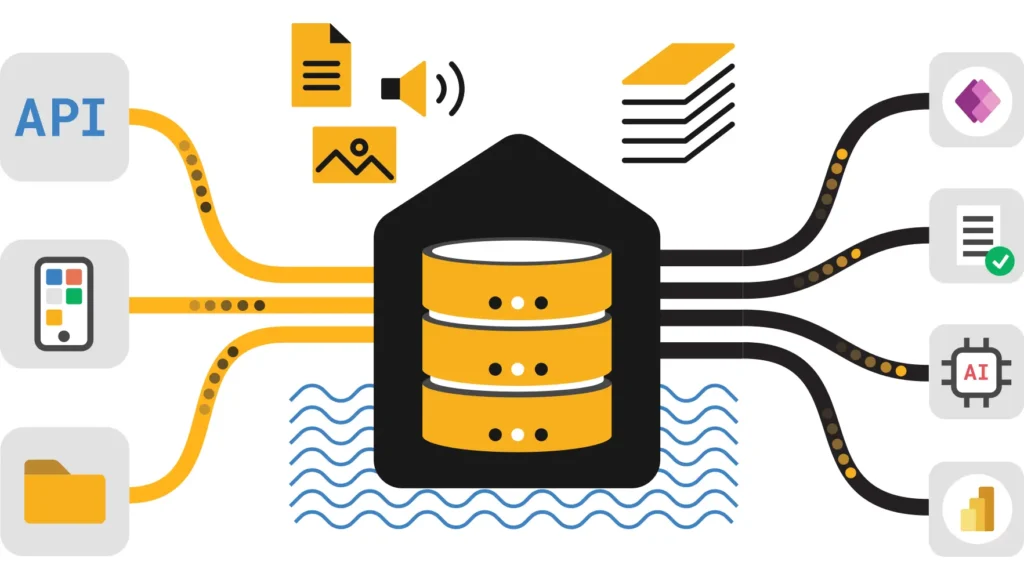
Optimizing the Fabric Data Warehouse covers five areas: storage organization (V-Order, OPTIMIZE, partitioning), ingestion (COPY INTO, INSERT…SELECT, batch sizing), query design (statistics, materialized views, filter pushdown), Direct Lake (V-Order by default on Warehouse tables since May 2026, Delta Analyzer, Semantic Link Labs), and capacity management (Capacity Metrics app, throttling thresholds, pause/resume). Proactive statistics refresh (January 2026) and incremental statistics refresh (January 2026) are now on by default. Result set caching was temporarily disabled in February 2026 — check the Known Issues page before relying on it.
Storage Organization
Query performance in Fabric Warehouse starts with how data is physically organized on disk. Delta Parquet files in OneLake are the foundation — how those files are sized, partitioned, and clustered determines whether your queries scan gigabytes or terabytes.
Partitioning Strategy
Partition large fact tables by low-cardinality columns that align with your most common query filters. Date is the most effective partition key for most analytical workloads — queries filtered by date can skip entire file partitions without scanning them.
Avoid over-partitioning. A partition column with thousands of distinct values creates thousands of small files, which increases Delta log metadata overhead and slows query planning. A good target is partitions that each contain at least several hundred MB of data after compaction.
-- Partition a fact table by year and month
CREATE TABLE dw.fact_sales
(
  order_id    INT            NOT NULL,
  customer_id INT            NOT NULL,
  sale_year   INT            NOT NULL,
  sale_month  INT            NOT NULL,
  amount      DECIMAL(18,2)
);
File Compaction with OPTIMIZE
Incremental loads — especially from pipelines that insert small batches — accumulate many small Parquet files. Small files increase per-file overhead during query planning and reduce read parallelism. Run OPTIMIZE periodically to compact them.
-- Compact small Delta files on a high-ingestion table
OPTIMIZE dw.fact_sales;

-- Add ZORDER to co-locate rows by a selective filter column
OPTIMIZE dw.fact_sales
ZORDER BY (customer_id);
ZORDER improves performance for selective queries on the Z-ordered column but adds write-time cost. Use it on columns that appear in WHERE clauses across many queries — not on columns used only occasionally.
The Delta Analyzer tool (see Section 06) is the right way to decide when to run OPTIMIZE. It shows file count, size distribution, and row group cardinality per table — run it before scheduling compaction jobs rather than running OPTIMIZE on a fixed timer regardless of actual file fragmentation.
Data Ingestion Patterns
How you load data into Fabric Warehouse affects both throughput and the downstream query performance of loaded tables. Two primary T-SQL ingestion patterns exist — COPY INTO for bulk loads from external storage, and INSERT…SELECT for cross-warehouse transformation queries.
COPY INTO — Bulk Ingestion from Azure Storage
COPY INTO is the fastest supported path for loading large volumes of data into Fabric Warehouse from ADLS Gen2 or OneLake shortcuts. It runs in parallel across the distributed engine and is the recommended approach for initial historical loads and daily bulk refreshes.
COPY INTO dw.fact_sales
FROM 'https://youraccount.dfs.core.windows.net/container/sales/*.parquet'
WITH (
  FILE_TYPE = 'PARQUET',
  CREDENTIAL = (IDENTITY = 'Managed Identity')
);
INSERT…SELECT — Cross-Warehouse Transformation
Use INSERT…SELECT for incremental loads that involve joins, filters, and transformations from Silver layer tables. This pattern supports referencing tables across Lakehouses and Warehouses in the same workspace.
INSERT INTO dw.fact_sales (order_id, customer_id, sale_year, sale_month, amount)
SELECT
  s.order_id,
  s.customer_id,
  YEAR(s.sale_date),
  MONTH(s.sale_date),
  s.amount
FROM refined.sales_clean s
WHERE s.sale_date >= DATEADD(DAY, -1, CAST(GETDATE() AS DATE))
  AND s.amount >= 0;
The June 2026 Fabric update includes a performance improvement for the Warehouse → Lakehouse data movement path when using Dataflow Gen2 staging compute. No configuration change needed — existing Dataflow Gen2 pipelines using this pattern are faster automatically.
Batch Sizing
For pipelines that load from source systems, target individual batch files above 100 MB before ingestion. Files smaller than this increase per-file scheduling overhead during COPY INTO and accumulate as small files requiring more frequent OPTIMIZE runs. If your source produces small files, stage and merge them in a Lakehouse notebook before loading into the Warehouse.
Query Optimization
Fabric’s distributed SQL engine handles query planning automatically, but query structure and schema design still determine whether the engine can skip data effectively and run plans in parallel.
Predicate Pushdown
Write WHERE clauses that the engine can evaluate against partition metadata before reading any Parquet files. Predicates on the partition column (e.g. sale_year, sale_month) enable partition pruning. Predicates on Z-ordered columns reduce the number of row groups read within each file.
-- Efficient: partition pruning + Z-ORDER benefit
SELECT region, SUM(amount) AS revenue
FROM dw.fact_sales
WHERE sale_year = 2026
  AND sale_month = 6
  AND customer_id BETWEEN 10000 AND 20000
GROUP BY region;

-- Inefficient: function on partition column prevents pruning
SELECT region, SUM(amount)
FROM dw.fact_sales
WHERE YEAR(sale_date) = 2026  -- use sale_year column instead
GROUP BY region;
Materialized Views for Hot Aggregations
Create materialized views for aggregations that power high-concurrency dashboards. The engine refreshes them incrementally — you do not manage refresh schedules. Queries that match a materialized view definition are automatically redirected to the pre-aggregated result.
CREATE MATERIALIZED VIEW dw.mv_daily_revenue
AS
SELECT
  sale_year,
  sale_month,
  region,
  SUM(amount)  AS total_revenue,
  COUNT(*)     AS order_count
FROM dw.fact_sales f
JOIN dw.dim_customer c ON f.customer_id = c.customer_id
GROUP BY sale_year, sale_month, region;
Run a small representative query against key columns immediately after your ETL pipeline completes. This pre-loads those column segments into the Fabric buffer pool so the first real user query hits warm cache rather than cold storage reads.
Avoid RLS in Warehouse for Direct Lake Models
Applying row-level security at the T-SQL layer in the Warehouse forces Power BI Direct Lake models to fall back to DirectQuery mode — which removes the performance benefit of Direct Lake entirely. For Power BI scenarios, apply RLS in the semantic model layer instead. Reserve T-SQL RLS for users accessing the Warehouse directly via SSMS, Tabular Editor, or API.
Statistics Management — January 2026 Updates
The query optimizer in Fabric Warehouse uses column statistics — histograms of value distribution — to build efficient query plans. Stale or missing statistics cause the optimizer to make poor cardinality estimates, leading to suboptimal join orders and over-allocated memory.
| Feature | Status | What It Does |
|---|---|---|
| Proactive statistics refresh | GA — Jan 2026 | Updates WA_Sys column statistics in the background before queries need them. Previously, stats were only refreshed during query execution — the first query that triggered an update bore the cost. |
| Incremental statistics refresh | GA — Jan 2026 | For INSERT-heavy tables, refreshes only the statistics for the newly added data rather than recomputing histograms for the entire table. Significantly faster for large tables with append-only load patterns. |
| Auto-created statistics | GA | Fabric automatically creates statistics on columns referenced in WHERE, JOIN, and GROUP BY clauses when they do not exist. Follow the WA_Sys naming convention. |
Both proactive and incremental statistics refresh are enabled by default. You do not need to run CREATE STATISTICS or UPDATE STATISTICS manually for system-managed statistics. For custom statistics on specific column combinations, you can still create them manually.
-- Check existing statistics on a table
SELECT
  stat_name,
  column_name,
  last_updated
FROM sys.dm_pdw_nodes_db_stats_properties
WHERE object_id = OBJECT_ID('dw.fact_sales')
ORDER BY last_updated DESC;Before January 2026, the first query after a large load often ran slowly because statistics were stale and the engine had to update them mid-execution. Proactive refresh eliminates this cold-start penalty. If you previously added workarounds — manual UPDATE STATISTICS calls in pipeline stored procedures — audit whether they are still needed. In most cases, they can be removed.
V-Order — Write-Time Parquet Optimization
V-Order is a Microsoft write-time optimization applied to Parquet files stored in OneLake. It applies a combination of special sorting, row group distribution, dictionary encoding, and compression that enables in-memory-like read performance for Fabric engines — SQL, Spark, and Power BI Direct Lake — without any query-side changes.
| Detail | Value |
|---|---|
| Write-time cost | ~15% increase in write time. One-time cost at write — all reads benefit permanently. |
| Read-time benefit | 10–50% faster Spark reads on V-Ordered files vs standard Parquet, per Microsoft documentation. Power BI Direct Lake column transcoding is significantly faster. |
| Default on Warehouse | Yes — enabled by default on all Fabric Data Warehouse tables. |
| Direct Lake dependency | Direct Lake mode depends on V-Order for fast column segment loading. Tables without V-Order may trigger DirectQuery fallback under high concurrency. |
| Spark compatibility | V-Ordered Parquet files are fully compatible with standard Parquet readers. Non-Fabric engines ignore the optimization and read normally. |
V-Order and ZORDER are different optimizations. V-Order is a Parquet encoding optimization applied at write time — it affects how data is compressed and arranged within row groups. ZORDER is a physical file layout optimization that controls which rows end up in which files. Both can be applied together: OPTIMIZE … ZORDER BY applies ZORDER and re-writes files with V-Order encoding.
Direct Lake on SQL — May 2026
Direct Lake on SQL, published in May 2026, extends Direct Lake mode to Power BI semantic models backed directly by Fabric Data Warehouse tables. Previously, Direct Lake was available only for Lakehouse Delta tables. This means warehouse-backed semantic models now achieve near-import query speeds without import refresh schedules or DirectQuery latency.
| Query Mode | Data Location | Refresh Required | Query Speed | Always Current |
|---|---|---|---|---|
| Import | VertiPaq in-memory (copied) | Yes — scheduled or manual | Fastest | No — refresh lag |
| DirectQuery | Source warehouse (live) | None | Slowest — source dependent | Yes |
| Direct Lake (Lakehouse) | OneLake Delta — Lakehouse | None | Near-import | Yes |
| Direct Lake on SQL | OneLake Delta — Warehouse | None | Near-import | Yes — May 2026 |
Prerequisites for Direct Lake on SQL
V-Order is applied by default to all Fabric Data Warehouse tables — no additional configuration required. For best results, ensure your warehouse tables are well-compacted (run OPTIMIZE on high-ingestion tables) and that your semantic model does not use T-SQL RLS on the warehouse side (use semantic model RLS instead to avoid DirectQuery fallback).
Delta Analyzer — Evaluate Physical Storage Layout
Delta Analyzer is a tool that evaluates the physical storage layout of Delta tables. It surfaces file counts, size distribution, row group cardinality, and V-Order compliance — the inputs you need to decide whether to run OPTIMIZE, adjust partition strategy, or investigate Direct Lake fallback causes.
Semantic Link Labs — Direct Lake Guardrail Evaluation
Semantic Link Labs is an open-source Python library for Fabric. Its Direct Lake functions evaluate whether a semantic model’s tables meet the guardrails required to stay in Direct Lake mode, identify which tables are falling back to DirectQuery and why, and surface row count and column cardinality metrics against the current F-SKU limits.
# Semantic Link Labs: check Direct Lake guardrails
import sempy_labs as labs

labs.direct_lake.check_fallback_reason(
    dataset="Sales Analytics Model",
    workspace="Production"
)Each F-SKU enforces different row count and column limits per table for Direct Lake mode. Exceeding these limits causes automatic fallback to DirectQuery for that table. Check current limits at Microsoft Learn — Fabric capacity licenses and use Semantic Link Labs to evaluate your model against the actual limits of your capacity.
Capacity Planning & Throttling
Fabric Warehouse runs on F-SKU capacity measured in Capacity Units (CUs). Understanding how CUs are consumed, how throttling works, and how to size and pause capacity correctly prevents performance degradation and cost overruns.
Throttling Stages
| Stage | Condition | Impact |
|---|---|---|
| Smoothing | Short burst above base CU rate | No visible impact — Fabric absorbs burst using a 24-hour smoothing window |
| Interactive delay | Sustained overuse past smoothing window | Interactive queries delayed by 20 seconds per request |
| Interactive rejection | Further sustained overuse | Interactive queries rejected with Error 24801 — Query Cancelled |
| Background rejection | Severe sustained overuse | Background jobs (pipelines, scheduled refreshes) rejected |
Pause and Resume Strategy
F-SKUs support pause and resume. A structured pause schedule reduces cost significantly for workloads that do not run 24/7. The key numbers: pausing nights and weekends on a business-hours schedule reduces runtime to roughly 260 hours per month versus 730 hours always-on — a reduction of about 64%.
When to Pause
- Outside business hours on weekdays
- Weekends when no scheduled pipelines run
- During planned maintenance windows
Pre-Resume Warm-Up
- Resume 10–15 minutes before first user queries
- Run a small warm-up query on key tables after resume
- Schedule pipelines to start after warm-up completes
For detailed pause architecture and reserved vs PAYG cost comparison, see Microsoft Fabric Capacity Optimization and Microsoft Fabric Pricing Calculator.
Power BI Integration Optimization
Power BI semantic models sitting on top of Fabric Warehouse have three connection options — Import, DirectQuery, and Direct Lake on SQL (May 2026). The right choice depends on data freshness requirements, dataset size, and concurrency.
DAX Optimization for Warehouse-Backed Models
When building semantic models on Fabric Warehouse tables, write DAX that avoids full table scans and row-by-row iteration. Variables eliminate repeated expression evaluation. CALCULATE with explicit filter arguments outperforms implicit context modification in complex models.
-- Inefficient: iterates every row
Revenue YTD = SUMX(FILTER(fact_sales, fact_sales[sale_year] = YEAR(TODAY())), fact_sales[amount])

-- Efficient: uses columnar aggregation with time intelligence
Revenue YTD = CALCULATE(SUM(fact_sales[amount]), DATESYTD(dim_date[date]))
Aggregation Tables for High Concurrency
For dashboards with many concurrent users, build aggregation tables in the Warehouse at daily, weekly, or monthly grain. Connect Power BI to the aggregation table as the primary source and the detail table for drill-through. This significantly reduces CU consumption per query because aggregation queries hit the smaller, pre-computed table.
With Direct Lake on SQL (May 2026), Power BI models backed by Fabric Warehouse tables load column data on demand from OneLake. There is no import refresh schedule to manage — the model always reflects the current warehouse state. This removes one of the largest operational burdens for warehouse-backed BI deployments.
Monitoring & Cost Optimization
Two tools form the foundation of Fabric Warehouse observability: the Microsoft Fabric Capacity Metrics app for capacity-level visibility, and query history in the Fabric portal for warehouse-level query analysis.
Fabric Capacity Metrics App
The Capacity Metrics app shows CU consumption over time, throttling events, and carryforward balance. Use it to identify which workloads consume the most CUs, when throttling occurred, and whether your F-SKU size is correctly matched to your workload pattern.
- Track utilization trend by day and hour to identify peak windows
- Monitor throttling frequency — more than occasional throttling signals F-SKU undersizing or a workload scheduling problem
- Analyse carryforward balance — a consistently negative balance means your workload consistently exceeds your base CU rate
Query History Analysis
In the Fabric portal, open your Warehouse item and navigate to Query activity. This shows execution duration, CU consumption, and query text for all recent queries. Sort by duration or CU cost to find the queries most worth optimizing.
-- In Fabric Warehouse: query execution history via DMV
SELECT TOP 20
  command,
  status,
  submit_time,
  end_compile_time,
  end_time,
  total_elapsed_time_ms
FROM sys.dm_pdw_exec_requests
WHERE status = 'Completed'
ORDER BY total_elapsed_time_ms DESC;
Log row counts, duration, and status after every pipeline run to a dw.load_audit table. This gives you a queryable history of load performance trends without relying solely on the Capacity Metrics app, and lets you detect data volume anomalies before they affect downstream reports.
Common Error Fixes
| Error / Symptom | Root Cause | Resolution |
|---|---|---|
| Error 24801 — Query Cancelled | Interactive query rejection due to sustained capacity throttling | Check the Capacity Metrics app for throttling history. Reschedule heavy batch workloads to off-peak hours. Avoid SELECT * on large tables. Consider upgrading F-SKU if throttling is frequent. |
| Direct Lake fallback to DirectQuery | Table exceeds F-SKU guardrail limits, or T-SQL RLS is applied on the warehouse table | Use Semantic Link Labs to identify which tables are falling back and why. Move RLS to the semantic model layer. Run OPTIMIZE to compact files if row group count is the issue. |
| Slow first query after pipeline load | Statistics stale after bulk INSERT — statistics refresh triggered during first query execution | Proactive statistics refresh (GA January 2026) should eliminate this. If still occurring, verify the feature is enabled and check whether you have manual UPDATE STATISTICS calls in your pipeline that may be conflicting. |
| Result set caching returns wrong results | Known issue — result set caching was disabled in February 2026 due to incorrect results for certain query patterns | Check the Fabric Known Issues page for current status. Do not rely on result set caching until Microsoft confirms the fix is live. |
| COPY INTO slow on many small files | Source files below 100 MB each — per-file scheduling overhead adds up | Stage and merge small files in a Lakehouse notebook before running COPY INTO. Target files of 100 MB or larger per file for optimal COPY INTO throughput. |
| OPTIMIZE takes too long | Running OPTIMIZE with ZORDER on a very large table rewrites all files | Run OPTIMIZE without ZORDER first to compact small files. Then run OPTIMIZE ZORDER in a separate step. For very large tables, partition first so OPTIMIZE can operate on one partition at a time. |
FAQ — Microsoft Fabric data warehouse optimization
Official Resources & Further Reading
This guide is verified against Microsoft Learn documentation and the Microsoft Fabric Community blog as of June 2026. Result set caching is currently disabled — check the Fabric Known Issues page before use. UIG Data Lab is an independent publication, not affiliated with or endorsed by Microsoft Corporation.