Fabric Data Agent Code Interpreter — Dynamic AI Analytics Guide
The Fabric Data Agent Code Interpreter adds a secure, sandboxed Python environment directly to your Fabric Data Agent. It moves agents beyond SQL and KQL queries into statistical analysis, time-series forecasting, correlation heatmaps, cohort analysis, and rich Python visualizations — all from natural language, no code required. This guide covers every detail verified against official Microsoft Learn documentation through June 2026.
The Fabric Data Agent Code Interpreter is a tool you add to an existing Fabric Data Agent from the Tools tab. Once enabled, the agent gains a secure sandboxed Python environment. When a question requires computation, statistical analysis, forecasting, or visualization, the agent routes query results to the Code Interpreter, generates Python code, executes it, and returns the output — charts, tables, and analysis — inline. No coding required. All generated Python code is inspectable in run steps. Feature is currently in public preview. Requires F2 or higher Fabric capacity.
What Is the Fabric Data Agent Code Interpreter?
The standard Fabric Data Agent answers natural language questions by translating them into SQL or KQL queries, running those queries against connected data sources, and returning the results. That covers a wide range of business questions — but it has a hard ceiling. SQL and KQL return rows and aggregations. They cannot compute a confidence interval, detect a correlation across multiple columns, forecast a trend with statistical bounds, or render a heatmap.
The Fabric Data Agent Code Interpreter removes that ceiling. When enabled, the agent adds a secure, sandboxed Python environment to its tool set. For questions that go beyond what a database query can answer, the agent queries the data source first, passes the results to the Code Interpreter, generates Python code to perform the required analysis or visualization, executes that code in the sandbox, and returns the output — chart, table, or computed value — alongside the answer.
The entire Python code generation, execution, and result packaging happens automatically based on the natural language question. No Python knowledge is needed to use the feature. The generated code is fully visible in run steps so analysts can verify exactly what the agent computed.
The Fabric Data Agent Code Interpreter is currently in public preview. Feature behaviour, capabilities, and limitations may change before general availability. Verify current status at Microsoft Learn before production deployment planning.
The Code Interpreter was announced in the Fabric June 2026 Feature Summary alongside improved query routing for SQL and KQL sources. Both updates were released together — the routing improvements ensure queries reach the right source reliably before Code Interpreter analysis runs on the results.
Prerequisites for Fabric Data Agent Code Interpreter
- Fabric capacity: A paid F2 or higher Fabric capacity, or Power BI Premium P1 or higher with Microsoft Fabric enabled. Trial capacities are not supported.
- Cross-geo AI settings: Cross-geo processing and cross-geo storing for AI must be enabled in Fabric admin tenant settings if your data and capacity are in different geographic regions. See Fabric data agent tenant settings for exact configuration steps.
- A connected data source with data: At least one of the following connected to the agent — Lakehouse, Warehouse, KQL database, Power BI semantic model, mirrored database, or ontology. You must have read access to the data source.
The Code Interpreter tool is not available in the agent interface until a data source is connected. It works on the results retrieved from those sources — it needs something to compute on. You also need an existing Fabric Data Agent item in a Fabric workspace. If you do not have one yet, see Microsoft Fabric Data Agent — Complete Guide for the full setup walkthrough before returning here.
How to Enable the Fabric Data Agent Code Interpreter
The Code Interpreter is added from the Tools tab inside your existing Fabric Data Agent. It takes four steps from opening the agent to the first Python-powered query.
- Open your Fabric Data AgentNavigate to the Fabric workspace where your Data Agent lives. Open the agent item.
- Select the Tools tabInside the agent configuration interface, select the Tools tab. This is where all agent tools — NL2SQL, NL2KQL, and Code Interpreter — are managed.
- Select Add code interpreterThe Tools tab displays available tools. Select Add code interpreter. A confirmation dialog appears explaining that the agent will use a sandboxed Python environment to execute code generated from your queries.
- Confirm in the dialogSelect Confirm in the confirmation dialog. The Code Interpreter tool is now added and active. No further configuration is required to start using it.
The confirmation dialog is intentional — adding Code Interpreter changes what the agent can do with retrieved data. Reviewing what the tool enables before confirming is worth the extra click, particularly in shared or production agents where unexpected Python execution could surprise other users of the same agent.
How the Fabric Data Agent Code Interpreter Works
The Code Interpreter does not replace SQL or KQL queries — it extends them. The agent follows a two-stage process for questions that require analysis or visualization beyond what a query alone can return.
| Stage | What Happens | Tool Used |
|---|---|---|
| Stage 1 — Data Retrieval | The agent translates the natural language question into SQL or KQL, executes the query against the connected data source, and retrieves the raw result set. | NL2SQL or NL2KQL |
| Stage 2 — Analysis | The agent determines that the question requires computation, visualization, or statistical analysis that goes beyond the raw result. It passes the retrieved data to the Code Interpreter, which generates Python code, executes it in a sandboxed environment, and returns the output. | Code Interpreter |
The Sandboxed Python Environment
The Code Interpreter runs in a secure, isolated sandbox. The Python execution environment is isolated from the rest of Fabric infrastructure — it has no network access, cannot read from or write to data sources directly, and cannot access any data beyond what the agent passes to it from the query results. The sandbox is the same execution environment used by OpenAI’s Code Interpreter tool, operating under Fabric’s governance and tenant boundary.
What Python Libraries Are Available
The sandboxed environment includes the standard Python data science library set — pandas, numpy, matplotlib, seaborn, scipy, sklearn, and plotly are available for analysis and visualization. The agent selects the appropriate library for each question automatically based on the type of output requested.
Visualizations
- Trend line charts with confidence intervals
- Correlation and pairwise heatmaps
- Cohort retention grids
- Distribution and histogram plots
- Scatter plots with regression lines
- Bar and grouped bar charts
Analysis & Computation
- Statistical significance testing
- Time-series forecasting
- Correlation coefficient calculation
- Cohort and segment analysis
- Mathematical computations on query results
- Cross-source result combination
One of the most useful capabilities the Code Interpreter adds is combining results from multiple data sources before analysis. A standard SQL query can only operate on tables within its connected source. The Code Interpreter receives results from multiple agent queries, merges them in Python, and runs the analysis on the combined dataset — something that previously required a separate notebook or pipeline step.
Example Queries — What the Code Interpreter Can Answer
These are question patterns verified from official Microsoft Learn documentation and the June 2026 Fabric Feature Summary. Each represents a question type that requires Code Interpreter — a standard SQL or KQL query alone cannot produce these results.
“Forecast next quarter’s revenue based on the past three years of sales data.”
“Forecast next quarter’s revenue with confidence intervals.”
“Create a cohort retention heatmap by signup month.”
“Test if conversion rates differ significantly between campaigns.”
“Generate a heatmap of claim frequency by region and cause of loss over the past five years.”
“Create a pairwise plot of customer tenure, monthly spend, and churn risk to explore correlations.”
“Build a correlation heatmap across all supplier performance metrics — contracted reliability score, lead time, on-time delivery, defect rate. Show which metrics move together.”
“Chart the monthly revenue trend for each product category over the last 24 months.”
The question framing matters more than the technical terminology. The agent does not require you to say “run a linear regression” or “generate a matplotlib chart.” Describing the business question — “forecast revenue” or “show me which supplier metrics are related” — is enough. The agent decides whether Code Interpreter is needed and what Python approach to use based on what the question requires.
Inspecting Results with Run Steps
After the Fabric Data Agent Code Interpreter produces a result, the run steps panel shows exactly how it was generated. This transparency is one of the most important features for production use — analysts can verify the analysis before acting on it.
What Run Steps Show
| Run Step | What It Shows | Use For |
|---|---|---|
| Query step | The SQL or KQL query the agent generated and executed against your data source | Verify the data retrieval was correct before trusting the analysis |
| Code Interpreter step | The full Python code the agent generated, the exact inputs passed to the sandbox, and the raw output returned | Validate the statistical method, check for edge cases, reproduce the analysis manually if needed |
| Output step | The final chart, table, or computed value returned to the user | The business-facing result with full lineage traceable through the previous steps |
To inspect a Code Interpreter run step: after the agent returns its answer, expand the run steps panel and select the Code Interpreter step. The panel shows the generated Python code, the data it received, and the output it produced. The screenshot below shows what this looks like in the Fabric Data Agent interface.
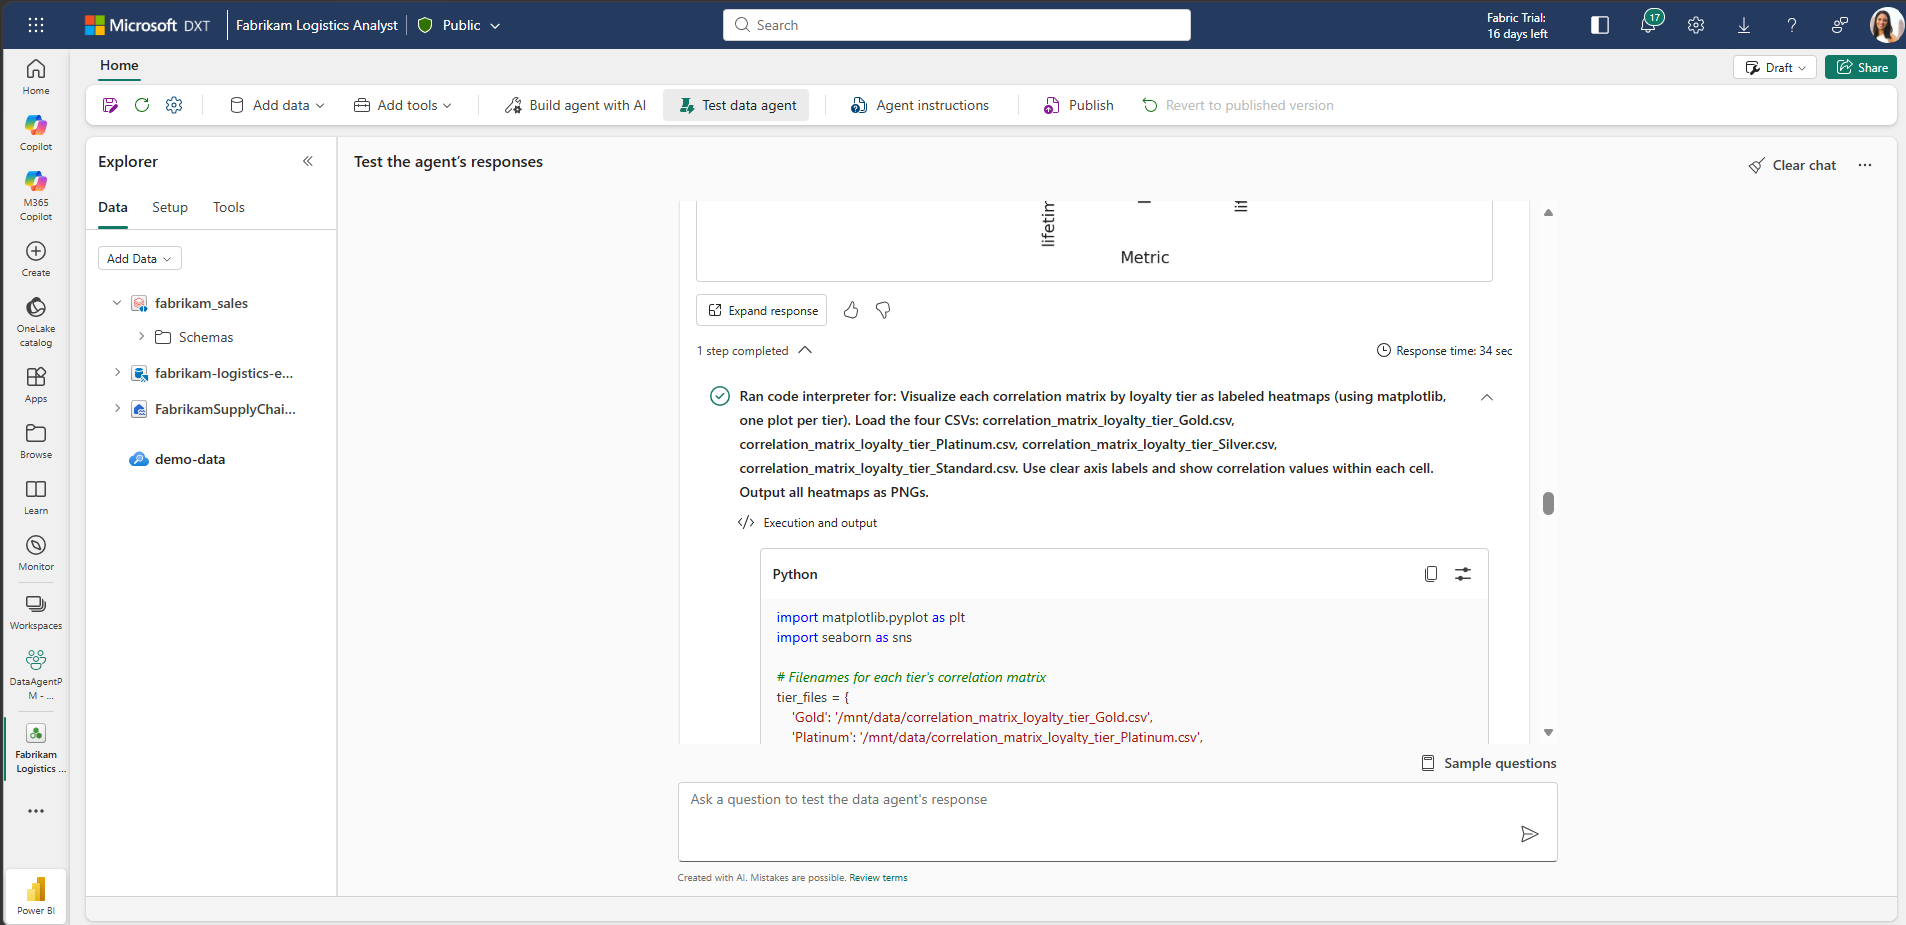
In regulated industries — finance, healthcare, insurance — the run steps provide an auditable record of exactly what the agent computed and from what data. Before relying on a Code Interpreter result for a business decision, expand the run steps, verify the query retrieved the expected data, and confirm the Python code applied the correct statistical method. The transparency is there by design.
Shaping Code Interpreter Behaviour with Agent Instructions
The Code Interpreter tool does not have its own instruction field — you cannot add instructions directly to it. To shape how and when the agent calls the Code Interpreter, use agent-level instructions in the agent configuration. These instructions apply to the agent as a whole and influence when it reaches for each tool.
Useful Instruction Patterns
Tool Preference Rules
- “For all statistical questions, prefer the Code Interpreter over returning raw query results.”
- “When a question asks for a trend or forecast, always generate a chart using Code Interpreter.”
- “For simple row counts or totals, return SQL results directly without invoking Code Interpreter.”
Output Format Rules
- “Always return visualizations as PNG with a white background.”
- “When generating heatmaps, include value labels on each cell.”
- “Round all percentage values to one decimal place in Code Interpreter outputs.”
Analytical Context Rules
- “For time-series forecasts, always use the past 36 months of data minimum.”
- “When testing statistical significance, use a 95% confidence level unless stated otherwise.”
- “Always note the sample size and time range in the analysis summary.”
Constraint Rules
- “Never include individual customer names or identifiers in visualizations.”
- “Do not return Code Interpreter outputs for data sets with fewer than 30 rows — flag the small sample size instead.”
For the full agent instruction configuration reference, see Configure your data agent — Microsoft Learn.
Code Interpreter vs SQL/KQL — When Each Is Used
The Fabric Data Agent selects the right tool for each question automatically. Understanding when it reaches for each tool helps write better questions and interpret results correctly.
| Question Type | Tool Used | Why |
|---|---|---|
| “What was total revenue in May 2026?” | NL2SQL | Simple aggregation — SQL returns the answer directly |
| “List the top 10 customers by order value this quarter” | NL2SQL | Sorting and filtering — standard SQL operation |
| “How many events occurred in each region last month?” | NL2KQL / NL2SQL | Count and group — database query is sufficient |
| “Is customer lifetime value correlated with acquisition channel?” | NL2SQL + Code Interpreter | SQL retrieves the data; Code Interpreter computes the correlation coefficient and significance |
| “Chart the revenue trend for each product category over 24 months” | NL2SQL + Code Interpreter | SQL retrieves the time series; Code Interpreter renders the multi-line trend chart |
| “Forecast next quarter’s revenue with confidence intervals” | NL2SQL + Code Interpreter | SQL retrieves historical data; Code Interpreter runs the forecast model and plots the result |
| “Combine supplier reliability scores with actual delivery rates and show correlations” | NL2SQL (×2) + Code Interpreter | SQL queries both sources; Code Interpreter merges and builds the correlation heatmap |
The June 2026 Fabric Feature Summary notes that query routing accuracy was improved for both SQL and KQL sources in the same update that introduced Code Interpreter. The routing improvements ensure queries reach the correct source reliably — which is the foundation that Code Interpreter analysis depends on. Better routing means Code Interpreter receives cleaner, more complete data to work with.
Fabric Data Agent Code Interpreter in Microsoft Teams & Copilot Studio
The Fabric Data Agent — with Code Interpreter enabled — can be deployed to Microsoft Teams through Copilot Studio, making Python-driven analytics and visualizations available directly inside Teams conversations. Business users can ask data questions in Teams and receive charts, forecasts, and statistical analysis without leaving the collaboration surface.
Deployment Path to Teams
- Enable Code Interpreter on the Data AgentComplete the Tools tab setup described in Section 03. Verify the agent returns visualizations correctly in the Fabric agent test interface before proceeding.
- Connect the Data Agent to Copilot StudioIn Copilot Studio, add the Fabric Data Agent as a connected agent or tool. The agent’s published API endpoint is called by Copilot Studio when data questions are detected in the conversation.
- Enable Code Interpreter in Copilot Studio agent settingsIn the Copilot Studio agent configuration, confirm Code Interpreter is enabled under the connected Fabric Data Agent’s settings. Without this, the Copilot Studio agent will call the Data Agent but Code Interpreter outputs may not render in Teams.
- Deploy to Microsoft TeamsPublish the Copilot Studio agent to Microsoft Teams. Users in Teams can now ask natural language data questions and receive Python visualizations and analysis inline in the Teams conversation.
Matplotlib and seaborn charts generated by Code Interpreter are returned as PNG images. Test that charts render correctly in your target Teams environment before rolling out to users. Complex plots with many data points may take a few seconds longer to generate than simple aggregations — set user expectations accordingly.
Fabric Data Agent Code Interpreter — Current Limitations
These are confirmed limitations as of June 2026 from the official Microsoft Learn documentation.
| Limitation | Detail |
|---|---|
| Public preview only | The Code Interpreter tool is in public preview. Feature behaviour and capabilities may change before general availability. Not recommended for production workloads where stability guarantees are required. |
| No direct instructions on the tool | You cannot add instructions directly to the Code Interpreter tool itself. Use agent-level instructions to shape when and how the agent calls it. |
| Sandboxed execution — no external access | The Python environment has no network access and cannot read from or write to data sources directly. It only operates on data the agent passes to it from query results. |
| F2 capacity minimum | Trial capacities are not supported. Requires paid F2 or higher Fabric capacity, or P1 Premium with Fabric enabled. |
| Cross-geo setting required in some regions | If the Fabric capacity and data source are in different geographic regions, cross-geo processing and cross-geo storing for AI must be enabled in tenant settings before Code Interpreter will function. |
| OpenAI Assistants API migration pending | The underlying programmatic interface uses OpenAI Assistants API (beta.assistants, beta.threads), which OpenAI has deprecated with a shutdown date of August 26, 2026. Fabric will migrate to the Responses API in a future update. Existing programmatic integrations must plan for this migration. |
| Power BI semantic model example queries | Adding sample query/question pairs is not currently supported for Power BI semantic model data sources. This affects how well the agent can be guided for semantic model-based questions. |
FAQ — Fabric Data Agent Code Interpreter
Official Resources — Fabric Data Agent Code Interpreter
This guide is verified against the official Microsoft Learn documentation page data-agent-code-interpreter (last updated May 27, 2026) and the Fabric June 2026 Feature Summary. The Code Interpreter tool is in public preview — behaviour and availability may change before GA. UIG Data Lab is an independent publication, not affiliated with or endorsed by Microsoft Corporation.