Data Observability vs Data Quality: A Practical Guide to a Resilient Data Ecosystem
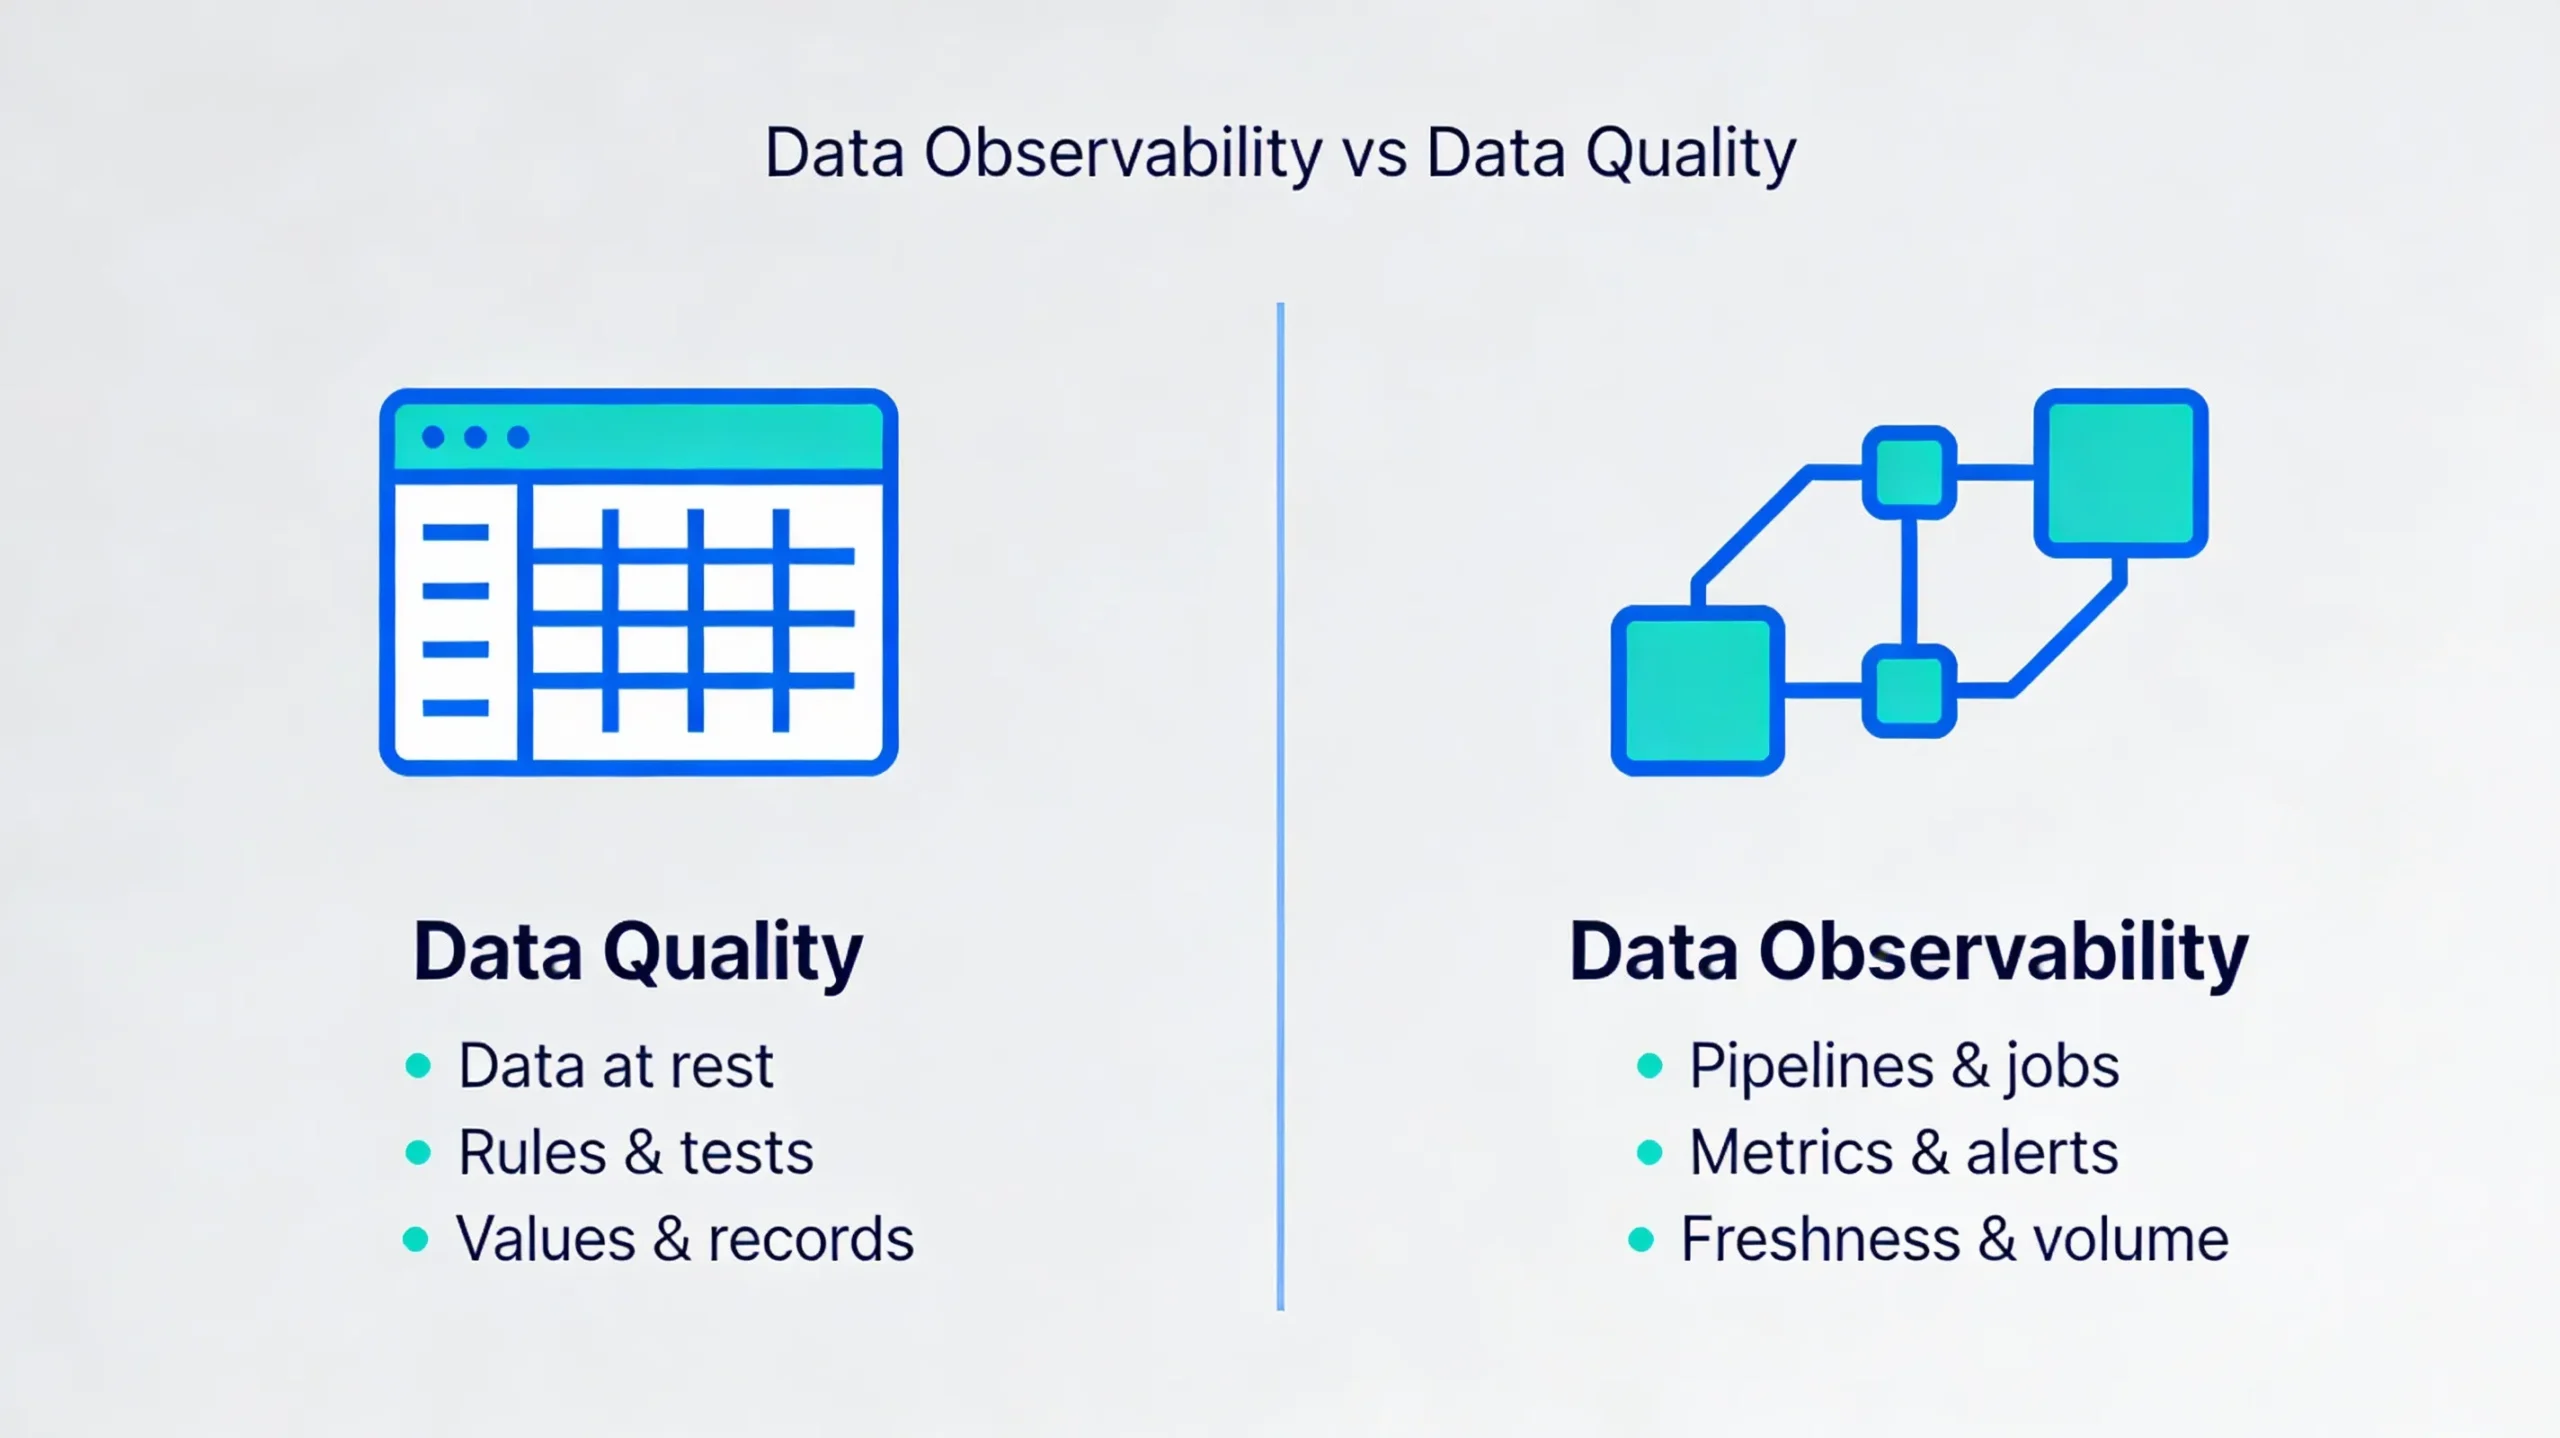
The Data Observability vs Data Quality conversation is everywhere, but the terms are often used loosely. Data quality looks at whether the data itself is accurate, complete, and trustworthy. Data observability looks at whether the pipelines and systems that produce that data are running as expected.
Instead of treating them as competing ideas, this guide shows how they fit together. You will see the core differences, the five pillars of data observability, and a simple workflow you can plug into tools like Airflow and dbt so teams catch issues early and fix the right thing first.
💡 Thinking about starting a small side income online?
Many creators start with simple tools and workflows — no investment required.
See how creators do it → CreatorOpsMatrix.comTable of Contents
- What Is Data Quality?
- What Is Data Observability?
- Data Observability vs Data Quality: Core Differences
- The Five Pillars of Data Observability
- Tools for Data Quality and Data Observability
- Implementation Blueprint: Combining Data Observability and Data Quality
- Use Cases and Common Anti-Patterns
- Data Observability vs Data Quality: Burning Questions
- Official Docs and Deep-Dive Resources
- Related Lakehouse & Data Engineering Guides
What Is Data Quality?
Data quality describes how closely data matches the expectations of the business. Good data is accurate, complete, consistent, valid, and unique enough for the decisions it supports. Bad data shows up as wrong numbers in dashboards, broken reconciliations, or machine learning models that quietly drift.
Most data quality work happens on data at rest: tables in your warehouse, files in your lake, or metrics in your BI layer. Engineers and analysts define rules and tests that describe “acceptable” data, then run those checks on a schedule or as part of each load.
Common Data Quality Checks
- Null and emptiness checks: Required fields such as user_id or order_date must not be null.
- Range and domain checks: Values like revenue, age, or status must fall within allowed ranges or sets.
- Referential integrity: Foreign keys must match valid records in reference tables.
- Uniqueness checks: Natural keys such as email or transaction_id must not contain unexpected duplicates.
What Is Data Observability?
Data observability is about how visible your data pipelines and systems are. If a job silently stops running, a schema changes upstream, or volume drops by half overnight, observability is what lets you notice quickly and trace the impact.
Instead of only checking final tables, data observability tracks signals like run times, freshness, row counts, schema changes, anomalies in distributions, and lineage. Those signals sit alongside logs and traces and give you a realistic picture of how healthy your data platform is from source to consumption.
Data Observability vs Data Quality: Core Differences
Both disciplines exist to make data more reliable. The difference is where they look and how they alert you when something is wrong. One focuses on the numbers your stakeholders see; the other focuses on the machinery that generates those numbers.
A simple analogy helps. Data quality is looking at the fuel gauge and odometer to check whether the readings make sense. Data observability is watching the engine temperature, oil pressure, and warning lights so you know when the car is about to fail and why.
| Feature | Data Quality (DQ) | Data Observability (DO) |
|---|---|---|
| Primary focus | Data at rest: values, records, and tables. | Data in motion: pipelines, jobs, and systems. |
| Main goal | Ensure accuracy, completeness, consistency, validity, and uniqueness. | Ensure pipeline health, reliability, timeliness, and resilience. |
| Typical timing | Point-in-time checks during profiling, validation, or load. | Continuous or near real-time monitoring across the lifecycle. |
| Typical fixes | Correct bad records or adjust rules (data fix). | Fix pipeline code, schedules, infrastructure, or configurations (system fix). |
| Tool examples | dbt tests, Great Expectations, Soda Core, warehouse constraints. | Data observability platforms, general observability tools, custom monitoring. |
The Five Pillars of Data Observability
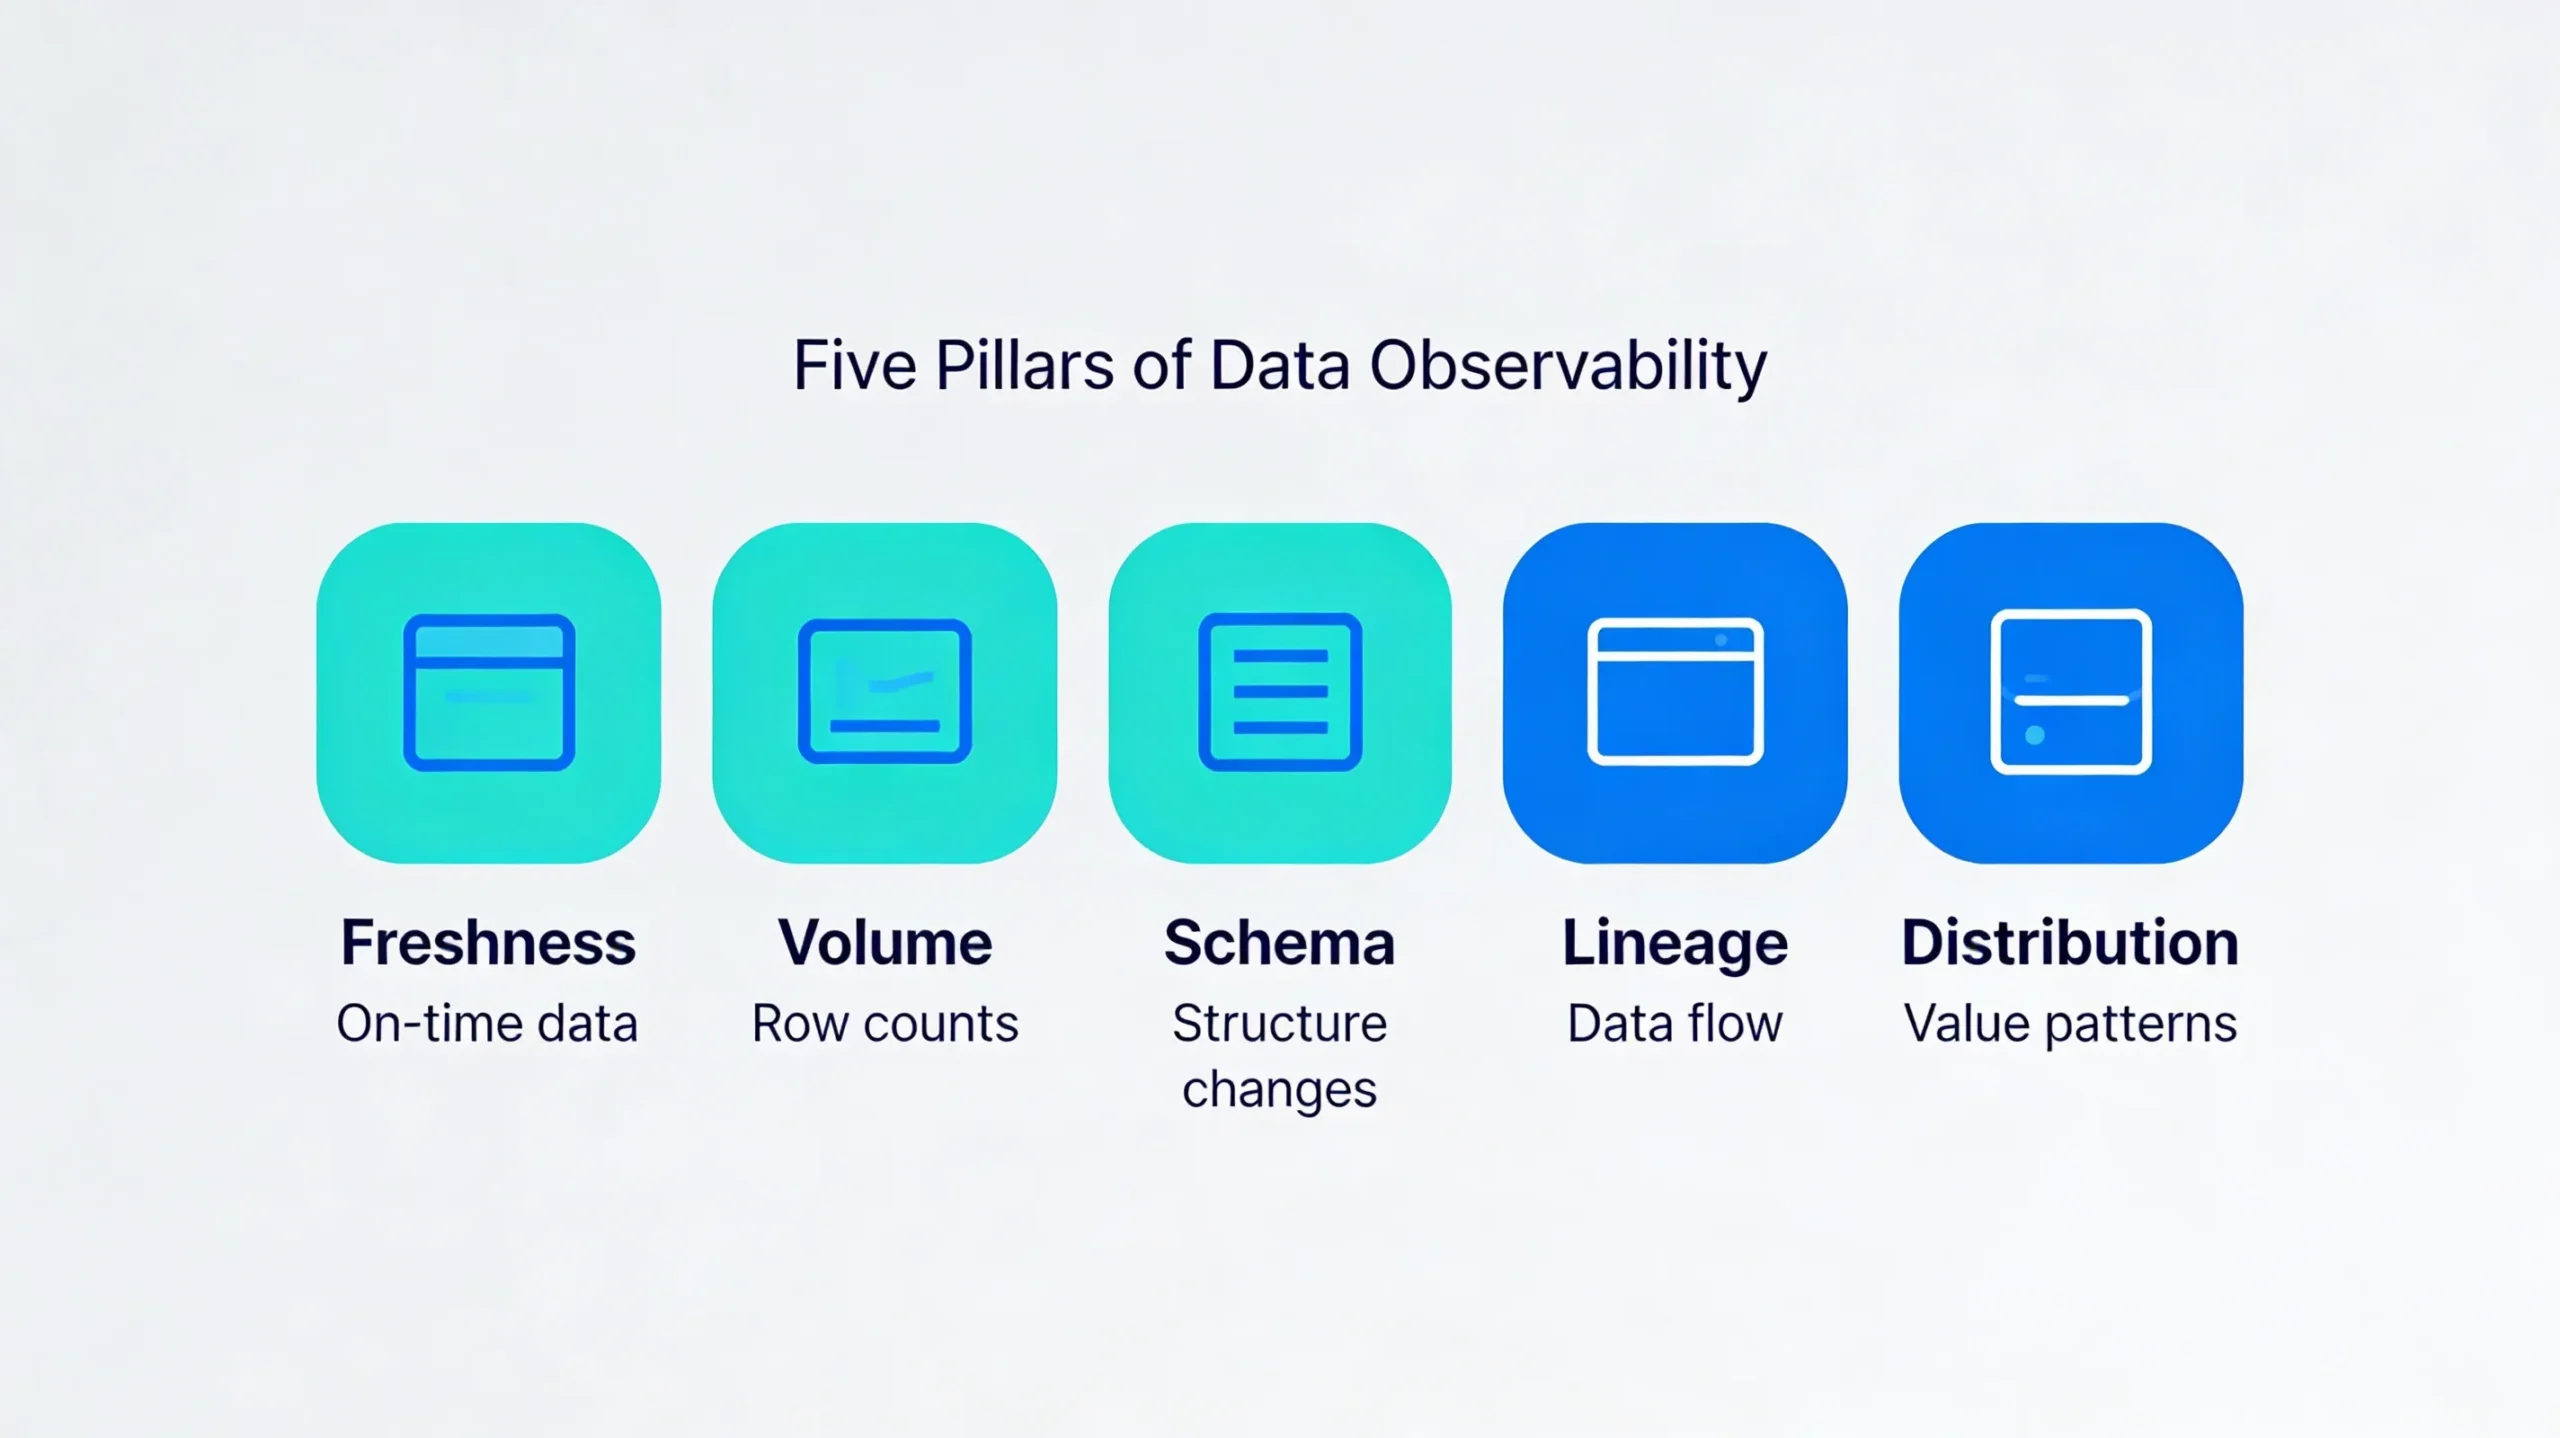
The five pillars of data observability give you a checklist for what to monitor. Freshness and volume tell you whether data arrived on time and in the right quantity. Schema and lineage show how pipelines connect and where they might have been broken. Distribution reveals outliers and odd behavior inside the data itself.
When you design monitoring, pair each pillar with one or more data quality checks. That way you see both the system symptom and the impact on the data consumers actually use.
Freshness
Freshness covers how up to date your data is. On the observability side, you watch whether jobs finish within their expected window and whether key tables meet their SLAs. On the quality side, you test that timestamp fields such as last_updated_at fall within the time range your reports expect.
Volume
Volume deals with how many records move through your pipelines. Observability compares current row counts to historical baselines and flags large drops or spikes. Data quality then confirms that final tables contain a reasonable number of rows and that counts across related tables still reconcile.
Schema
Schema changes can break pipelines in subtle ways. Observability detects unexpected column additions, removals, or type changes so you can react before downstream queries fail. Data quality checks ensure that critical output tables still match an agreed schema and highlight rows that violate those expectations.
Lineage
Lineage shows how data flows from source systems through transformations to dashboards and APIs. Observability uses lineage to answer “what broke where” when an incident occurs. Data quality uses that context to verify that key data products are sourced from the correct systems of record and not from deprecated or shadow sources.
Distribution
Distribution focuses on the statistical shape of your data: averages, percentiles, cardinality, and value frequencies. Observability spots anomalies such as a 5x spike in average order value or a sudden drop in distinct users. Data quality turns known expectations into rules so you catch slow drifts before they surface as bad decisions.
Tools for Data Quality and Data Observability
The tool landscape changes quickly, but the patterns stay the same. You have rule-based and contract-based tools focused on data quality, and you have platforms that specialize in collecting metrics, building baselines, and alerting on anomalies across pipelines.
In most teams, it works best to pick a small, opinionated stack: one main way to write quality tests and one primary place to view pipeline health, then connect both to your orchestrator and alerting channels.
Data Quality Tools
- dbt tests: Built-in checks and packages that validate assumptions about models written in SQL.
- Great Expectations: A framework for defining and running human-readable data expectations in Python.
- Soda and similar platforms: YAML- or UI-driven rules that define and monitor data quality checks across environments.
- Warehouse-native constraints: NOT NULL, CHECK, and foreign key constraints in platforms like Snowflake, BigQuery, or Fabric.
Data Observability Tools
- Dedicated data observability platforms: Managed tools that provide end-to-end monitoring, anomaly detection, metrics, and lineage for data pipelines.
- General observability stacks: Platforms such as Datadog or Splunk extended with data-focused dashboards, metrics, and alerts.
- Custom monitoring frameworks: In-house solutions that emit metrics from jobs and track SLAs in systems like Prometheus, Grafana, or OpenTelemetry.
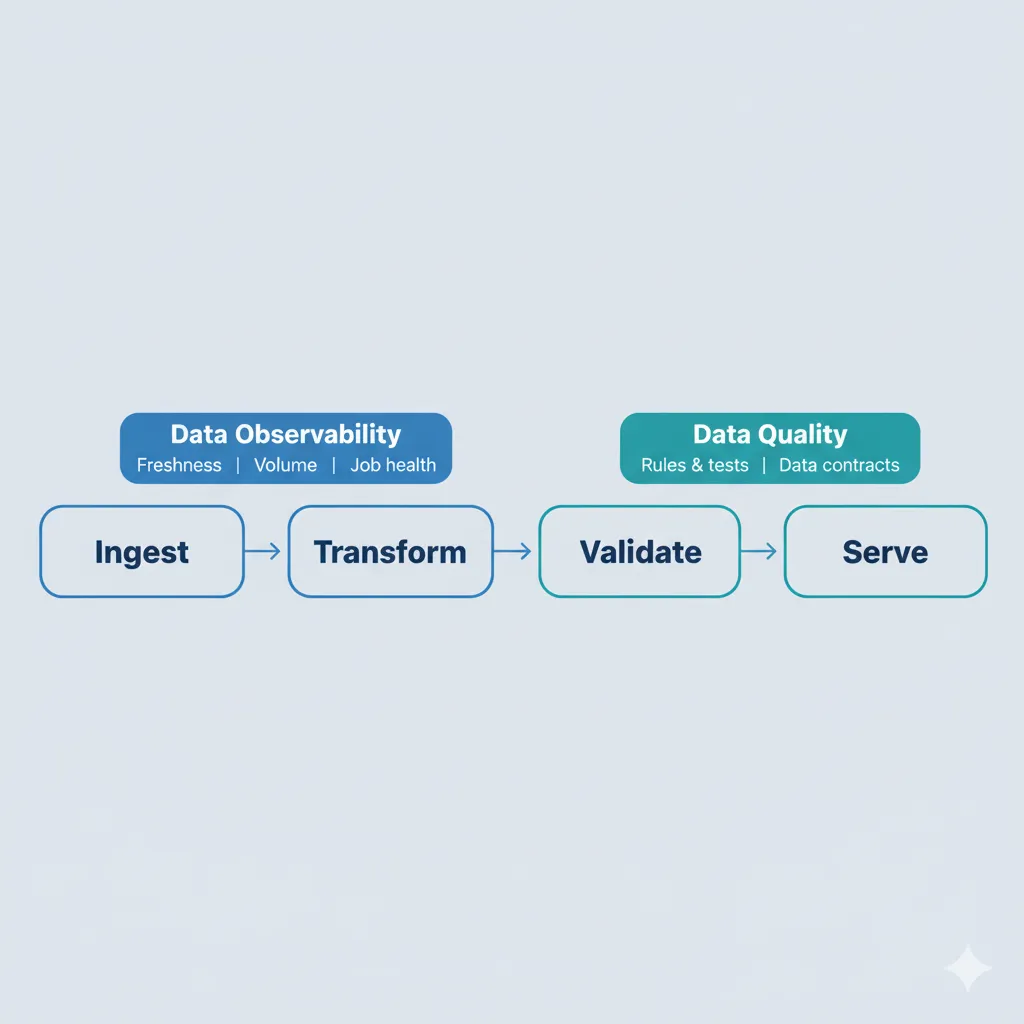
Implementation Blueprint: Combining Data Observability and Data Quality
It is tempting to buy a tool and hope reliability improves on its own. A better approach is to treat observability and quality as first-class steps in every pipeline. The orchestrator becomes the place where you define when to emit metrics, when to run tests, and where to send alerts.
The example below uses Airflow and dbt, but the same pattern works with other schedulers and transformation frameworks.
Step-by-Step Workflow with Airflow and dbt
- Ingestion: Use Airflow or another orchestrator to pull data from sources into your lake or warehouse. At the end of each ingestion task, emit metrics such as record counts, run duration, and status.
- Observability checks: Add sensors that check freshness and volume against historical baselines or SLAs. If a run is late or volume deviates significantly, raise an alert and gate downstream tasks until someone investigates.
- Transformations: Run dbt models or SQL transformations to build curated tables and marts. Along the way, log runtime and row-count metrics so you can spot regressions over time.
- Data quality checks: Execute dbt tests, Great Expectations suites, or similar checks on the transformed tables. Focus first on the dimensions and facts that power revenue, finance, and executive dashboards.
- Unified alerting: Route both observability alerts (delayed jobs, volume anomalies, schema drifts) and data quality failures (failed tests, broken contracts) to shared channels like Slack or PagerDuty. Make it easy to see which team owns the fix.
Use Cases and Common Anti-Patterns
Theory is useful, but day-to-day reliability lives in details. A few simple patterns can dramatically reduce noisy alerts and surprise incidents, while some common habits almost guarantee late-night firefighting.
Think of the examples below as starting points. You can adapt them to your domain, but the underlying ideas tend to hold across e-commerce, finance, SaaS analytics, and internal BI platforms.
Good Patterns
- Freshness SLAs for key tables: Business-critical datasets have clearly defined freshness expectations, observability checks monitor them, and alerts trigger when those expectations are not met.
- Tiered data quality tests: Critical tables have strict, always-on tests, while less critical tables have lighter coverage appropriate to their impact.
- Root cause through lineage: When a data quality test fails, lineage and observability metrics quickly reveal which upstream job, source, or schema change caused the issue.
Common Anti-Patterns
- Only end-of-pipeline checks: Running data quality tests only at the final stage leads to late detection and long incident resolution times.
- Only system metrics: Monitoring job success and runtime without explicit data quality rules creates a false sense of safety, because “green” pipelines can still produce incorrect numbers.
- Fragmented alerting: Sending pipeline failures to one channel and data quality failures to another leaves teams unsure who owns what and slows down the response.
Data Observability vs Data Quality: Burning Questions
Is data observability replacing traditional data quality?
It is not a replacement. Data observability tells you when pipelines behave strangely and where to look. Data quality tells you whether the values themselves are acceptable. When you rely on only one of them, you either miss root causes or miss incorrect data entirely.
Do I still need data quality tests if I have a data observability tool?
Yes. Observability tools can detect anomalies without understanding your business rules. Only explicit data quality tests and contracts can encode what “good data” means for your organization, such as which values are allowed or which joins must hold.
How should I define SLAs and SLOs for data?
A practical way is to start from the reports executives rely on every week. For each one, define how fresh and how accurate the underlying data must be, then translate those expectations into SLAs and SLOs on the tables that feed those reports.
What should I monitor first: freshness, volume, or schema?
Freshness and volume usually give the fastest wins. Once you have alerts when tables are late or when row counts are off, you can layer schema and distribution checks on top. This staged approach avoids overwhelming teams with alerts on day one.
How do I choose between data quality and data observability tools?
If silent pipeline failures are your main pain, start with observability and add more structured data tests later. If dashboards often show clearly wrong numbers, invest first in data quality tests and contracts, then bring in observability to reduce the time you spend searching for root causes.
How can small teams adopt data observability without a big budget?
Smaller teams can begin with simple health checks in their orchestrator, basic metrics in a time-series database, and a handful of high-value data tests. Over time, as pipelines and stakeholders grow, it becomes easier to justify a dedicated observability platform.
Where do data contracts fit into data observability and data quality?
Data contracts define clear expectations at the boundaries between producers and consumers. Data quality tests verify that those expectations hold, while data observability shows when upstream changes or incidents cause contracts to be violated.
How does data observability relate to DevOps and SRE practices?
Data observability borrows ideas from DevOps and SRE, such as SLIs, SLOs, and incident reviews, and applies them to data pipelines. The mindset is the same: measure what matters, watch it continuously, and improve systems after each incident instead of treating failures as one-off events.