Operations Agent in Microsoft Fabric — In-Depth Guide
- What Is an Operations Agent?
- Microsoft Fabric Real-Time Intelligence (RTI)
- Why Operations Agents Are Critical for Operations
- How to Create and Configure an Operations Agent
- Supported Data Sources
- Architecture & Data Flow
- Example Operations Agent Configuration
- Governance, Safety & Best Practices
- Operations Agent vs Data Agent
- Real-World Use Cases
- Common Challenges & Pitfalls
- Frequently Asked Questions (FAQ)
- Resources & Further Learning
What Is an Operations Agent?
The Operations Agent is a core feature of Microsoft Fabric’s Real-Time Intelligence (RTI) platform. It continuously monitors streaming telemetry data such as metrics, logs, and events, then applies configurable rules and AI-based reasoning to analyze this data in near real-time.
Unlike passive monitoring tools, the Operations Agent proactively recommends or triggers actions—such as sending alerts, initiating workflows, or scaling resources—to help operational teams detect and respond to issues faster. Importantly, many actions require human approval, delivering a balance between automation and control.
💡 Thinking about starting a small side income online?
Many creators start with simple tools and workflows — no investment required.
See how creators do it → CreatorOpsMatrix.com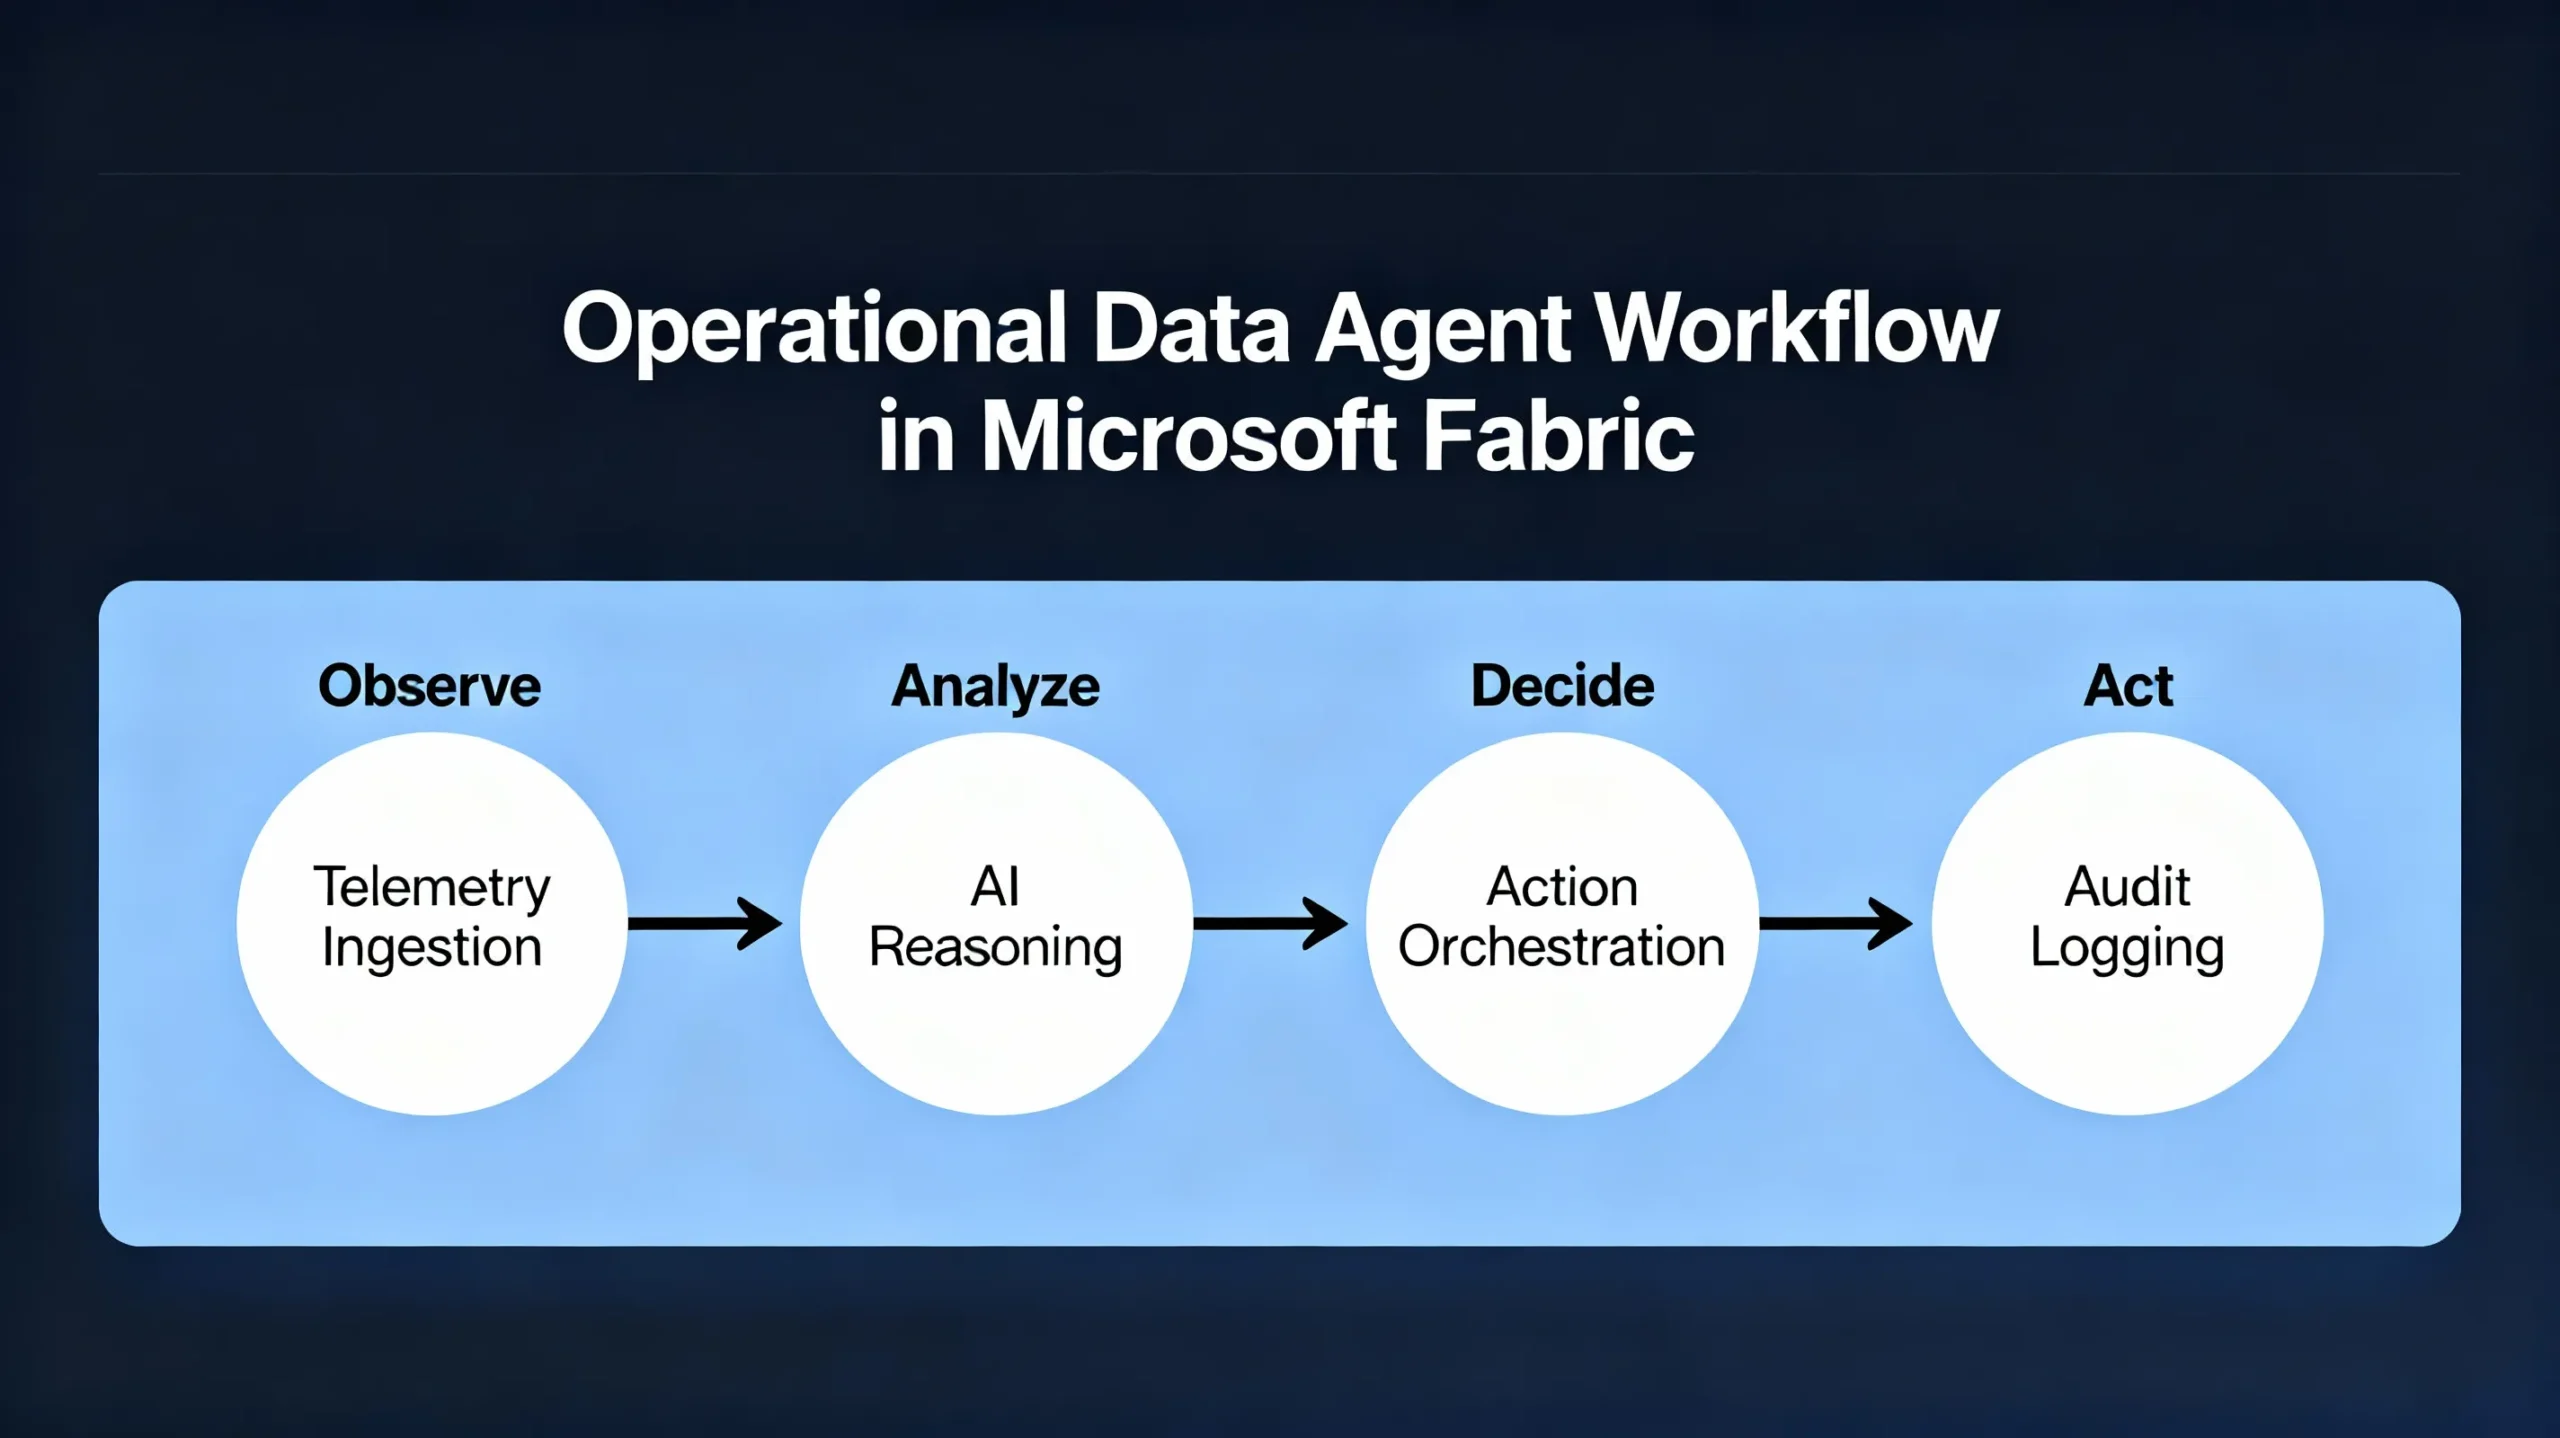
Microsoft Fabric Real-Time Intelligence (RTI)
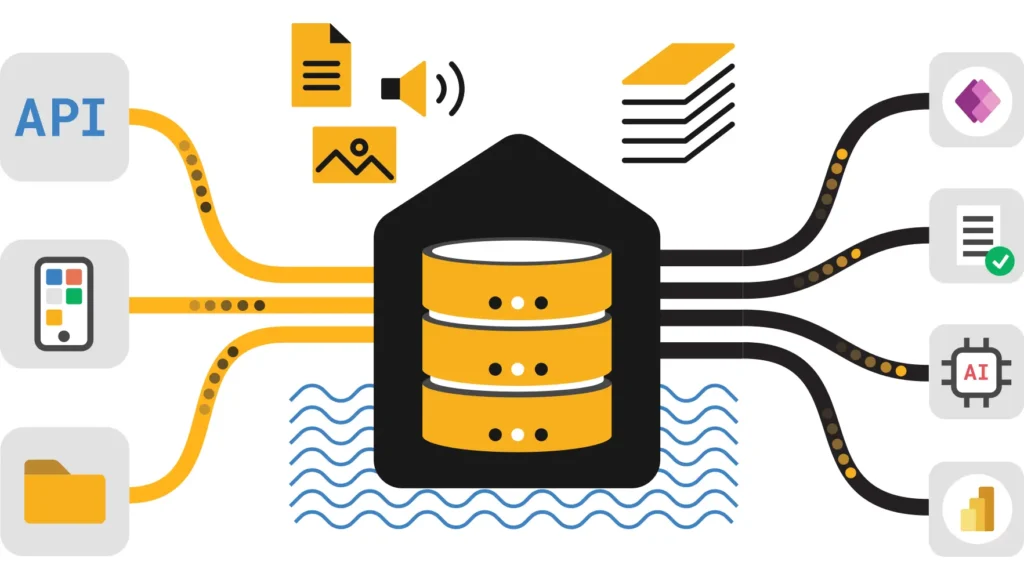
Operations Agents are built on the foundational Real-Time Intelligence (RTI) workload of Microsoft Fabric. RTI ingests high-velocity telemetry data from event sources like Azure Event Hubs or IoT Hub, storing it in Kusto (KQL) databases optimized for real-time analytics and detection at sub-second latencies.
RTI provides features such as Copilot for RTI, which enables natural language queries and low-code programming for analytic insights and operational reasoning. This integration empowers non-engineers to author detection logic and automate actions easily through the Fabric portal.
Why Operations Agents Are Critical for Operations
Operations Agents offer several key benefits to modern operational teams:
- Rapid anomaly detection to identify patterns such as spikes, drops, or other irregular telemetry behavior before they escalate.
- Automated recommendations and controls that propose or initiate actions like scaling resources or opening tickets, with configurable human approvals to maintain safety.
- Context-enriched insights that correlate alert data with deployment versions, service configurations, and historical trends for more actionable intelligence.
- Full audit and traceability through an automatically generated operations playbook capturing decisions, reasoning, and actions for compliance and incident review.
- Business-aligned monitoring by defining agent goals based on high-level company priorities and service-level objectives (SLOs).
How to Create and Configure an Operations Agent
Follow these steps to create and set up an Operations Agent within Microsoft Fabric’s Real-Time Intelligence environment:
- Open your Fabric workspace and choose Create → Real-Time Intelligence → Operations Agent.
- Assign a meaningful name that reflects the agent’s monitoring focus, such as
API Latency Watcher. - Define the business goals and monitoring objectives—for example, tracking latency, error rates, or resource utilization relevant to your service.
- Author agent instructions to interpret telemetry data in the context of these goals. Use natural language descriptions supplemented with Kusto Query Language (KQL) snippets and AI reasoning guidelines to shape how the agent evaluates data.
- Select your data source: Currently, this must be a KQL database table sourced from telemetry ingested into Fabric RTI.
- Set up detection rules using KQL queries or thresholds that trigger when telemetry metric conditions are met—these can include statistical baselines, anomalies, or hard limits.
- Define actions the agent can recommend or trigger, such as sending alerts to Microsoft Teams, invoking Power Automate workflows, calling webhooks, or opening service tickets.
- Optionally configure approval gates, requiring specific actions to be manually approved through the Teams interface before execution, ensuring safety and auditability.
- Save the operations agent configuration. Fabric generates an operations playbook encapsulating monitoring goals, detection logic, reasoning flow, and action sequences.
- Install the Fabric Operations Agent Teams app for real-time notifications and approval workflows integrated within your collaboration environment.
- Test the agent rigorously by replaying historical telemetry data to validate detection rules and action recommendations, tuning sensitivities as needed.
- Once tested, deploy the Operations Agent to begin live monitoring and operational automation on your streaming telemetry data.
Supported Data Sources
The Operations Agent currently supports monitoring only Kusto Query Language (KQL) databases within the Fabric Real-Time Intelligence platform. It cannot directly monitor data from lakehouse or warehouse tables.
Operational teams typically ingest telemetry and streaming data to KQL via Event Hubs or similar services, enabling the agent to perform low-latency detection and decision-making on this data.
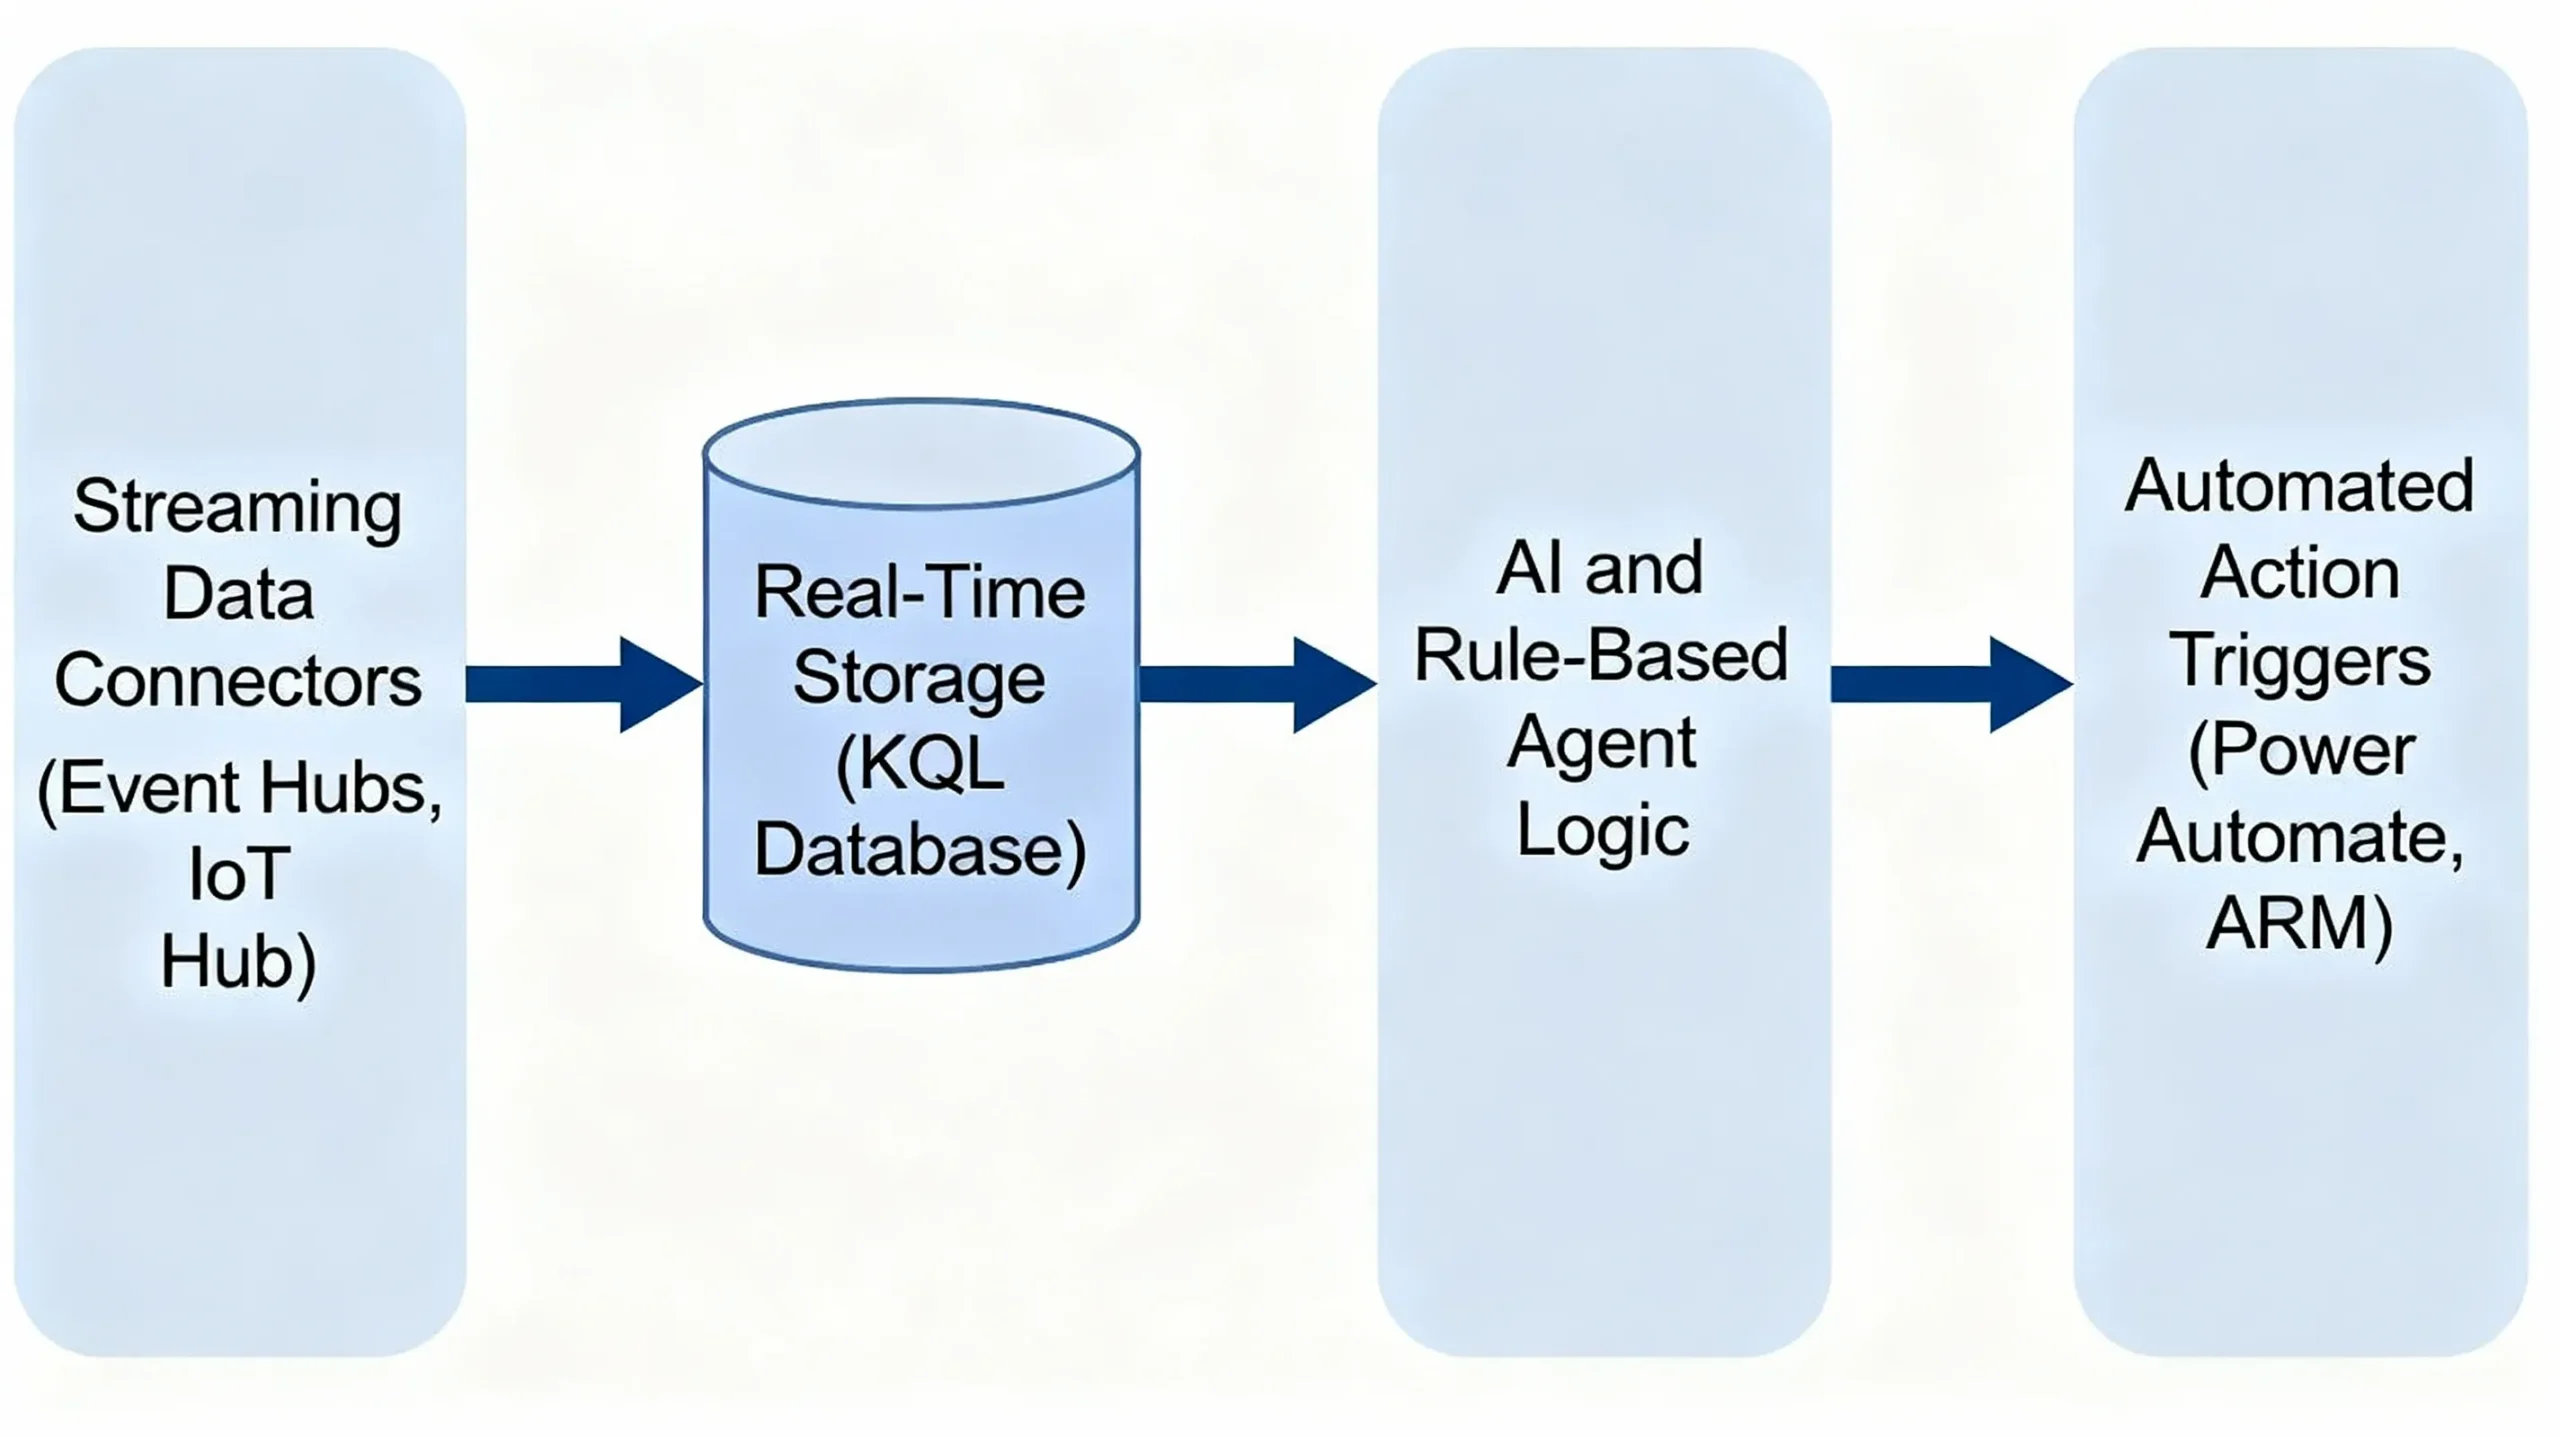
Operations Agent Architecture & Data Flow
The architecture combines streaming data ingestion, real-time analytics, AI-based reasoning, and action orchestration:
- Event Ingestion: Applications, infrastructure, and IoT devices generate telemetry streamed into Fabric via Event Hubs or IoT Hubs.
- Real-Time Storage: Incoming telemetry is persisted into KQL databases optimized for fast querying and analysis.
- Contextual Enrichment: The agent enriches telemetry with metadata such as deployment versions, resource configurations, and historical baselines.
- Rule Evaluation: Detection rules and AI reasoning evaluate enriched telemetry for anomalies, threshold breaches, or pattern matches.
- Action Recommendation: Based on evaluation, the agent recommends or triggers actions with optional human approval gates.
- Logging and Playbook Persistence: All decisions, each step’s reasoning, and executed or recommended actions are logged into an operations playbook for audit and troubleshooting.
Example Operations Agent Configuration
Below is a high-level conceptual example showcasing the agent’s declarative configuration using YAML-style pseudocode:
operations_agent: "api-latency-monitor"
data_source:
kql_database: "prodTelemetry"
detection_rules:
- id: "high_latency"
condition: "p95_latency > 1200 AND error_rate > 0.02"
severity: "critical"
enrich_with:
- lookup: "deployment_versions"
actions:
- id: "alert_teams"
type: "teams.send"
message: "⚠️ API latency is too high — please review immediately."
- id: "recommend_auto_scale"
type: "powerautomate.invoke"
flow_name: "ScaleUpApiInstances"
safety_limits:
max_auto_actions_per_hour: 2
audit_log:
table: "operations_agent_decision_log"
This specification illustrates how telemetry data, enriched with deployment metadata, drives alerts and recommended automation within safe operational limits, including auditing of decisions.
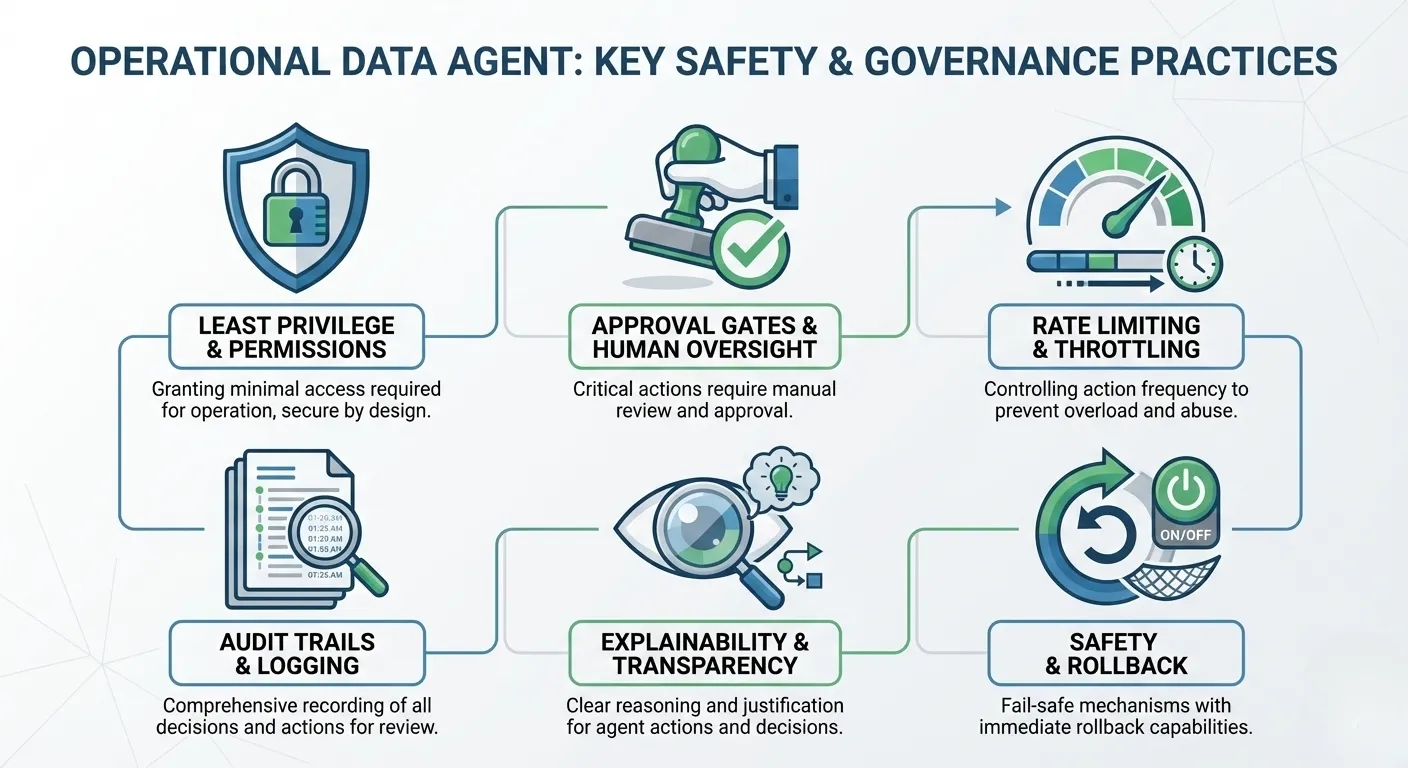
Governance, Safety & Best Practices
To ensure safe and trustworthy automation through Operations Agents, follow these best practices:
- Use Least-Privilege Identities: Create and run the agent under a dedicated service principal with just enough permissions necessary for the intended automated actions.
- Require Approval Gates for Critical Actions: Configure manual approval flows for sensitive or impactful actions to prevent unintended consequences.
- Implement Rate Limiting: Limit the frequency of automated actions such as scale-outs to avoid runaway or cascading effects.
- Comprehensive Audit Trails: Log every detection, reasoning path, recommendation, and action execution to facilitate incident reviews and compliance.
- Test Extensively: Use replayed or synthetic telemetry to validate detection logic and action workflows before live deployment.
- Explainability: Capture and surface underlying AI or rule-based reasoning for each agent decision to build operator confidence and enable iterative improvement.
Operations Agent vs Data Agent in Microsoft Fabric
Microsoft Fabric offers both Operations Agents and Data Agents, which serve distinct but complementary purposes in the Fabric ecosystem.
- Operations Agent: Built on the Real-Time Intelligence (RTI) platform, Operations Agents focus on monitoring operational telemetry such as logs, metrics, and streaming events in near real-time. They continuously observe and analyze system behavior and can recommend or automate responses like scaling resources, sending alerts, or triggering workflows. They require a Kusto (KQL) database as their data source and are designed primarily for DevOps, SRE, and operational automation scenarios.
- Data Agent: Data Agents provide AI-powered proactive assistance across a broader range of data sources, including SQL databases, lakehouses, warehouses, and files. They help users by answering natural language queries, generating insights, and assisting with data exploration and business intelligence tasks. Data Agents emphasize conversational AI and self-service analytics, making them valuable for data professionals and business users.
In summary, while Operations Agents are specialized for near real-time operational monitoring and automating incident response, Data Agents focus on enhancing data interaction and analysis through AI-driven conversational interfaces across diverse data domains.
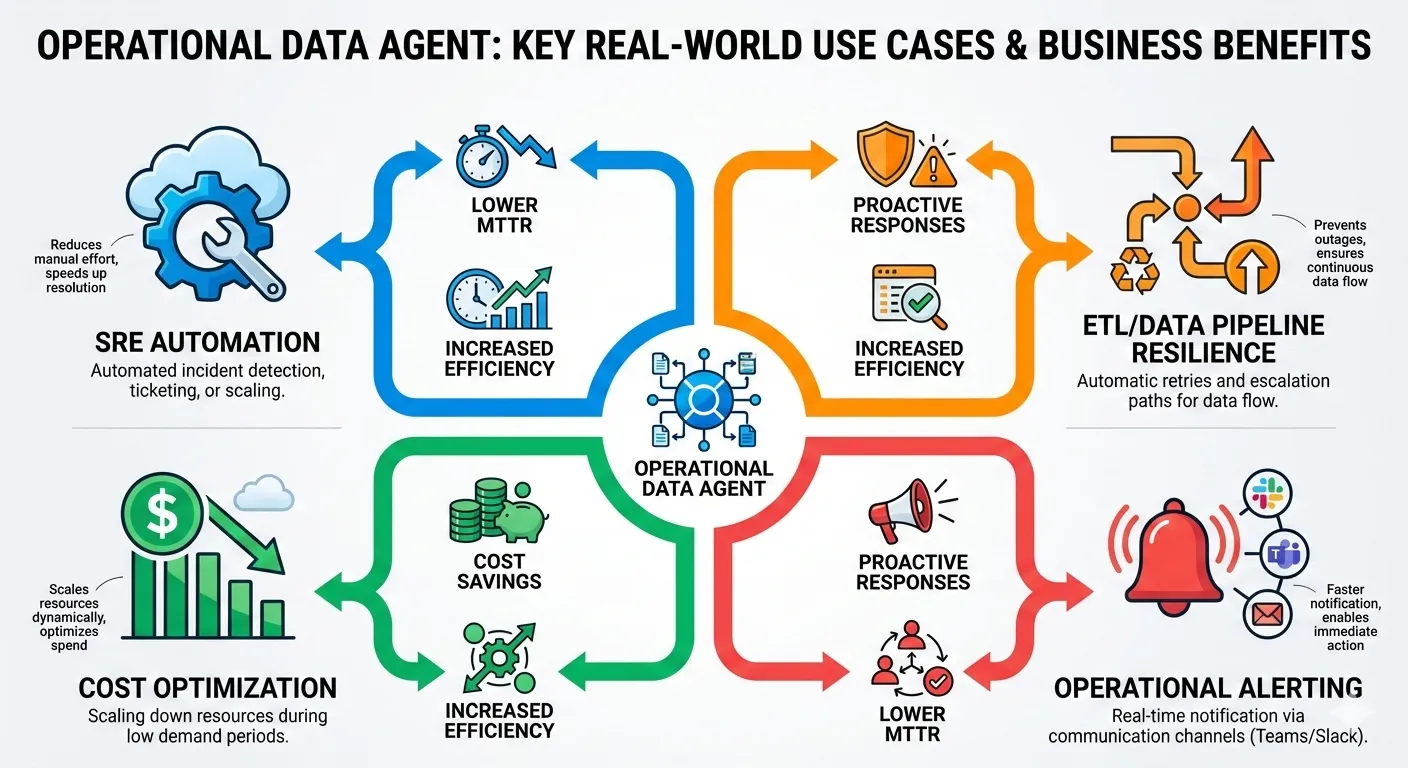
Real-World Use Cases
Operations Agents are highly valuable across multiple operational domains:
- SRE & DevOps Automation: Detect system degradations and recommend or automate remediation quickly.
- Data Pipeline Reliability: Monitor complex ETL and streaming workflows and automate recovery on failure.
- Cost Optimization: Identify and recommend scaling down of idle environments during off-peak hours to reduce cloud costs.
- Business Process Alerts: Alert business teams of anomalies in transaction or conversion metrics aligned with revenue impact.
- Incident Investigation: Enrich alerts with deployment and config context for faster triage and post-mortem analysis.
Common Challenges & Pitfalls
Key challenges when adopting Operations Agents include:
- Overly Sensitive Detection Rules: Excessive alert noise can overwhelm and desensitize operational teams.
- Insufficient Context: Alerts without enrichment lack critical business context reducing actionability.
- Missing Rollback Paths: Automation must have safe undo or manual fallback strategies to handle errors.
- Limited Audit Visibility: Without full logging, debugging and compliance auditing become difficult.
- Skipping Pre-Deployment Testing: Unvalidated rules can cause unintended disruptions in production.
Frequently Asked Questions (FAQ)
Q: Is the Operations Agent generally available for production?
A: The Operations Agent is in public preview; thorough validation is advisable before production deployment.
Q: Can Operations Agents monitor lakehouse or warehouse tables?
A: No, they currently only support KQL databases within the Real-Time Intelligence platform.
Q: What actions can an Operations Agent perform?
A: It can recommend or trigger sending Teams messages, invoking Power Automate flows, calling webhooks, or opening service tickets.
Q: How does the Operations Agent decide when to act?
A: Actions are based on user-defined detection rules applied to enriched telemetry, with execution gated by configured approval policies.
Q: Does the agent support human approval before actions?
A: Yes, approval gates can be set up to require manual review before critical automated actions execute.